Now we get to start actual data science!
This week: Exploratory Data Analysis
How to summarize data
Interpretting summaries
Visualizing data
interpretting summaries
Summarizing and Visualizing Data are very important
People cannot interpret high dimensional or large samples quickly
Important in EDA to help you make decisions about the rest of your analysis
Important in how you report your results
Summaries are similar calculations to performance metrics we will see later
visualizations are often essential in debugging models
We start by loading pandas as usual
import pandas as pdWe will continue with the coffee data
coffee_data_url = 'https://raw.githubusercontent.com/jldbc/coffee-quality-database/master/data/robusta_data_cleaned.csv'
coffee_df = pd.read_csv(coffee_data_url,index_col=0)
Describing a Dataset
So far, we’ve loaded data in a few different ways and then we’ve examined DataFrames as a data structure, looking at what different attributes they have and what some of the methods are, and how to get data into them.
The describe method provides us with a set of summary statistics that broadly
coffee_df.describe()And these all give us a sense of the values and the distribution or spread fo the data in each column.
It does not work on all of the columns though, remember how many there are:
coffee_df.columnsIndex(['Species', 'Owner', 'Country.of.Origin', 'Farm.Name', 'Lot.Number',
'Mill', 'ICO.Number', 'Company', 'Altitude', 'Region', 'Producer',
'Number.of.Bags', 'Bag.Weight', 'In.Country.Partner', 'Harvest.Year',
'Grading.Date', 'Owner.1', 'Variety', 'Processing.Method',
'Fragrance...Aroma', 'Flavor', 'Aftertaste', 'Salt...Acid',
'Bitter...Sweet', 'Mouthfeel', 'Uniform.Cup', 'Clean.Cup', 'Balance',
'Cupper.Points', 'Total.Cup.Points', 'Moisture', 'Category.One.Defects',
'Quakers', 'Color', 'Category.Two.Defects', 'Expiration',
'Certification.Body', 'Certification.Address', 'Certification.Contact',
'unit_of_measurement', 'altitude_low_meters', 'altitude_high_meters',
'altitude_mean_meters'],
dtype='object')it only works on the numeric ones.
it also works on indvidual methods.
coffee_df['Balance'].describe()count 28.000000
mean 7.541786
std 0.526076
min 5.250000
25% 7.500000
50% 7.670000
75% 7.830000
max 8.000000
Name: Balance, dtype: float64Understanding Quantiles
The 50% has another more common name: the median. It means 50% of the data are lower (and higher) than this value.
For example this is equivalent to the 25%:
balance_sorted = coffee_df['Balance'].sort_values().values
balance_sorted[6]np.float64(7.5)balance_sortedarray([5.25, 6.83, 7. , 7.17, 7.42, 7.5 , 7.5 , 7.5 , 7.5 , 7.58, 7.58,
7.58, 7.58, 7.67, 7.67, 7.67, 7.75, 7.75, 7.75, 7.75, 7.83, 7.83,
7.83, 7.92, 7.92, 7.92, 7.92, 8. ])Individual Statistics
All of the stats from the describe method are available as individual functions
coffee_df['Flavor'].min()np.float64(6.67)The quantiles are tricky, we cannot just .25%() to get the 25% percentile, we have to use the
quantile method and pass it a value between 0 and 1.
coffee_df['Flavor'].quantile(.8)np.float64(7.83)coffee_df['Aftertaste'].mean()np.float64(7.559642857142856)Categorical Variables
So far, the stats above are only for numerical features.
We can get the prevalence of each one with value_counts, this can also allow us to answer certain questions. Let’s try a few.
coffee_df['Color'].value_counts()Color
Green 20
Blue-Green 3
Bluish-Green 2
Name: count, dtype: int64What Country is most common in this dataset?
extension: Can you assign it directly to a variable fully programmatically?
coffee_df['Country.of.Origin'].value_counts()Country.of.Origin
India 13
Uganda 10
United States 2
Ecuador 2
Vietnam 1
Name: count, dtype: int64We can see from the output that India is the highest with max
If we want to access these programmatically, we can save it to a variable first to work with it more easily
country_counts = coffee_df['Country.of.Origin'].value_counts()then max gives the value
country_counts.max()np.int64(13)and idxmax or index max gives the index of the max value, here the country
Notebook Cell
country_counts.idxmax()'India'Answering Questions with EDA tools
For example, maybe we want to know:
How many coffees are high in Flavor?
But we could operationalize this in many ways for example:
How many are above a threshold we choose?
How many are above the mean?
How many coffees are more than one standard deviation above the average in Flavor ?
We’ll use that last one, here.
How many coffees are more than one standard deviation above the average in Flavor ?
First we’ll pull the mean and std to variables.
flav_mean = coffee_df['Flavor'].mean()
flav_std = coffee_df['Flavor'].std()

flav_mean,flav_std
(np.float64(7.630714285714285), np.float64(0.30365585505120485))We can use boolean expressions with pd.Series objects and it will test each element and then return a pd.Series in the same shape
coffee_df['Flavor'] > flav_mean+flav_stdOutput
1      True
2     False
3     False
4     False
5     False
6     False
7     False
8     False
9     False
10    False
11    False
12    False
13    False
14    False
15    False
16    False
17    False
18    False
19    False
20    False
21    False
22    False
23    False
24    False
25    False
26    False
27    False
28    False
Name: Flavor, dtype: bool
I hid the output, but you can click to view it.
It might be easier to consume by comparing the shape of the two:
flav_series = coffee_df['Flavor']
flav_bool_series = coffee_df['Flavor'] >  flav_mean+flav_std
flav_series.shape == flav_bool_series.shapeTrueassert checks that two things match, it is develoepd for testing
Then we can use that boolean series to mask the whole DataFrame and either directly:
coffee_df[coffee_df['Flavor'] > flav_mean+flav_std]or by saving it and using that series to mask
high_flav = coffee_df['Flavor'] >  flav_mean+flav_std
coffee_df[high_flav]there is also a where method, but it puts NaN in all of the false places, so I tend to not find it as helpful.
coffee_df.where(coffee_df['Flavor'] > flav_mean+flav_std)Split-Apply-Combine
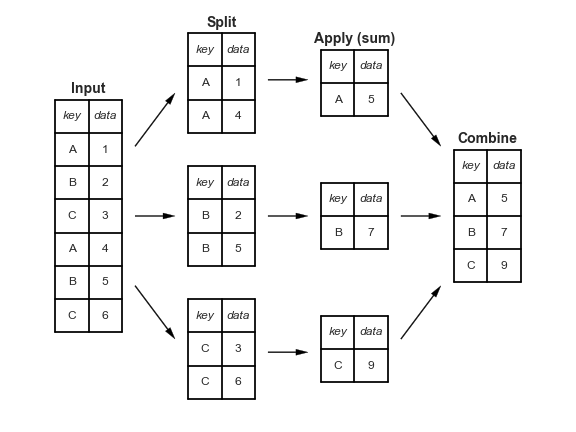
see it in action on pandas tutor
What country has the highest flavor scores?
Again, we can operationalize this question a couple of different ways. It is a stronger answer if the same answer appears fro multiple ways. We wil use highest average.
First we can use the value counts as context
coffee_df['Country.of.Origin'].value_counts()Country.of.Origin
India 13
Uganda 10
United States 2
Ecuador 2
Vietnam 1
Name: count, dtype: int64Then we can use groupby to create get a mean for the flavor of each column.
coffee_df.groupby('Country.of.Origin')['Flavor'].mean()Country.of.Origin
Ecuador 7.625000
India 7.640769
Uganda 7.758000
United States 7.415000
Vietnam 6.670000
Name: Flavor, dtype: float64This is equivalent to:
grouby_var = 'Country.of.Origin'
stat_col = 'Flavor'
country_list  = sorted(pd.unique(coffee_df[grouby_var]))
country_flavs = {}

for country in country_list:
    country_rows = coffee_df[grouby_var] ==country
    country_df = coffee_df[country_rows]
    country_flavs[country] = country_df[stat_col].mean()


pd.Series(country_flavs,index=pd.Index(country_flavs.keys(),name=grouby_var), name=stat_col)
Country.of.Origin
Ecuador 7.625000
India 7.640769
Uganda 7.758000
United States 7.415000
Vietnam 6.670000
Name: Flavor, dtype: float64It is more efficient somewhat because it cleans up a bit and it is a lot more readable to use groupby than to write that all out, but seeing it can help make what groupby does more clear.
Working with multiple columns at a time
If we want to see two variables by country, for example flavor and aftertaste, we might try:
coffee_df.groupby('Country.of.Origin')['Flavor','Aftertaste'].mean()---------------------------------------------------------------------------
ValueError Traceback (most recent call last)
Cell In[26], line 1
----> 1 coffee_df.groupby('Country.of.Origin')['Flavor','Aftertaste'].mean()
File ~/.local/lib/python3.12/site-packages/pandas/core/groupby/generic.py:1947, in DataFrameGroupBy.__getitem__(self, key)
1943 # per GH 23566
1944 if isinstance(key, tuple) and len(key) > 1:
1945 # if len == 1, then it becomes a SeriesGroupBy and this is actually
1946 # valid syntax, so don't raise
-> 1947 raise ValueError(
1948 "Cannot subset columns with a tuple with more than one element. "
1949 "Use a list instead."
1950 )
1951 return super().__getitem__(key)
ValueError: Cannot subset columns with a tuple with more than one element. Use a list instead.this does not work because 'Flavor','Aftertaste' is a tuple.
Pandas does not support picking multiple items with a tuple, that is reserved for multi-indexes. It does support picking multiple with a list though, as the error says on the last line, so we can use:
coffee_df.groupby('Country.of.Origin')[['Flavor','Aftertaste']].mean()The inner [] tie the two together as a list and the outer [] are for the indexing.
More explicitly, this is equivalent:
stat_columms = ['Flavor','Aftertaste']
coffee_df.groupby('Country.of.Origin')[stat_columms].mean()here we made the list explicitly first, saved it as a variable and then used it
Plotting in pandas
pandas has a few built in plot functions
coffee_df['Balance'].hist()<Axes: >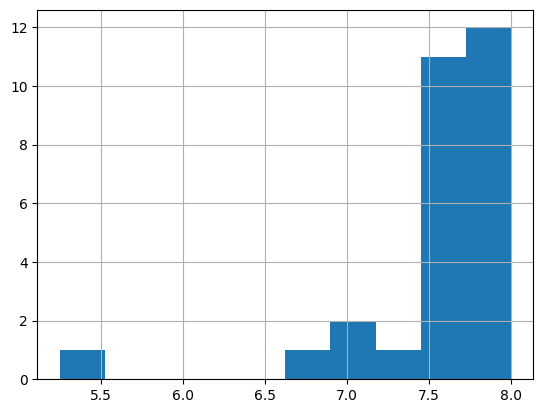
coffee_df.plot(x='Flavor', y='Balance',kind='scatter')<Axes: xlabel='Flavor', ylabel='Balance'>
Prepare for next class
Seaborn is a plotting library that gives us opinionated defaults
import seaborn as snsIf you get ModuleNotFound error, open a terminal tab and run pip install seaborn .
seaborn’s alias is sns as an inside joke among the developers to the character, Samual Norman Seaborn from West Wing they named the library after per their FAQ
Save a dataset
coffee_df.to_csv('robusta.csv')coffee_df_local = pd.read_csv('robusta.csv',index_col=0,)We can see it looks the same as the coffee data we had before
coffee_df_local.head()Questions
how strict will the grading be on following PEP8?
pep8 is important, but it also prioritizes that readability is the overall most important goal.
For early assignments, you will probably be okay as long as we can understand, but we will give you tips. We expect you to apply them for future assignments.
How do you get the Python help (the little window to see what is available to use)?
shift +tab inside of any ()
Why do you need index_col=0 when first defining the data frame?
We need that for this dataset because it includes an identifier, if a dataset does not have that, you do not need it.
When doing multiple parameters like more than 2, do we still use only double brackets?
Yes, like we did two in
coffee_df.groupby('Country.of.Origin')[['Flavor','Aftertaste']].mean()
you would use two sets of [] or even better make a list explicitly.