
8. Fixing Values#
o far, we’ve dealt with structural issues in data. but there’s a lot more to cleaning.
Today, we’ll deal with how to fix the values within the data.
8.1. Cleaning Data review#
Instead of more practice with these manipulations, below are more
examples of cleaning data to see how these types of manipulations get used.
Your goal here is not to memorize every possible thing, but to build a general
idea of what good data looks like and good habits for cleaning data and keeping
it reproducible.
All Shades Also here are some tips on general data management and organization.
This article is a comprehensive discussion of data cleaning.
8.1.1. A Cleaning Data Recipe#
not everything possible, but good enough for this course
Can you use parameters to read the data in better?
Fix the index and column headers (making these easier to use makes the rest easier)
Is the data strucutred well?
Are there missing values?
Do the datatypes match what you expect by looking at the head or a sample?
Are categorical variables represented in usable way?
Does your analysis require filtering or augmenting the data?
8.2. What is clean enough?#
This is a great question, without an easy answer.
It depends on what you want to do. This is why it’s important to have potential questions in mind if you are cleaning data for others and why we often have to do a little bit more preparation after a dataset has been “cleaned”
Dealing with missing data is a whole research area. There isn’t one solution.
in 2020 there was a whole workshop on missing
one organizer is the main developer of sci-kit learn the ML package we will use soon. In a 2020 invited talk he listed more automatic handling as an active area of research and a development goal for sklearn.
There are also many classic approaches both when training and when applying models.
example application in breast cancer detection
Even in pandas, dealing with missing values is under experimentation as to how to represent it symbolically
Missing values even causes the datatypes to change
That said, there are are om Pandas gives a few basic tools:
dropna
fillna
Filling can be good if you know how to fill reasonably, but don’t have data to spare by dropping. For example
you can approximate with another column
you can approximate with that column from other rows
Special case, what if we’re filling a summary table?
filling with a symbol for printing can be a good choice, but not for analysis.
whatever you do, document it
import pandas as pd
import seaborn as sns
import numpy as np
na_toy_df = pd.DataFrame(data = [[1,3,4,5],[2 ,6, np.nan],[np.nan]*4,[np.nan,3,4,5]], columns=['a','b','c','d'])

# make plots look nicer and increase font size
sns.set_theme(font_scale=2)

# todays data
arabica_data_url = 'https://raw.githubusercontent.com/jldbc/coffee-quality-database/master/data/arabica_data_cleaned.csv'

coffee_df = pd.read_csv(arabica_data_url)
8.3. Missing values#
We tend to store missing values as NaN or use the constants:
pd.NA, np.nan
(<NA>, nan)
Pandas makes that a special typed object, but converts the whole column to float
Numpy uses float value for NaN that is defined by IEEE floating point standard
type(pd.NA),type(np.nan)
(pandas._libs.missing.NAType, float)
Floats are weird
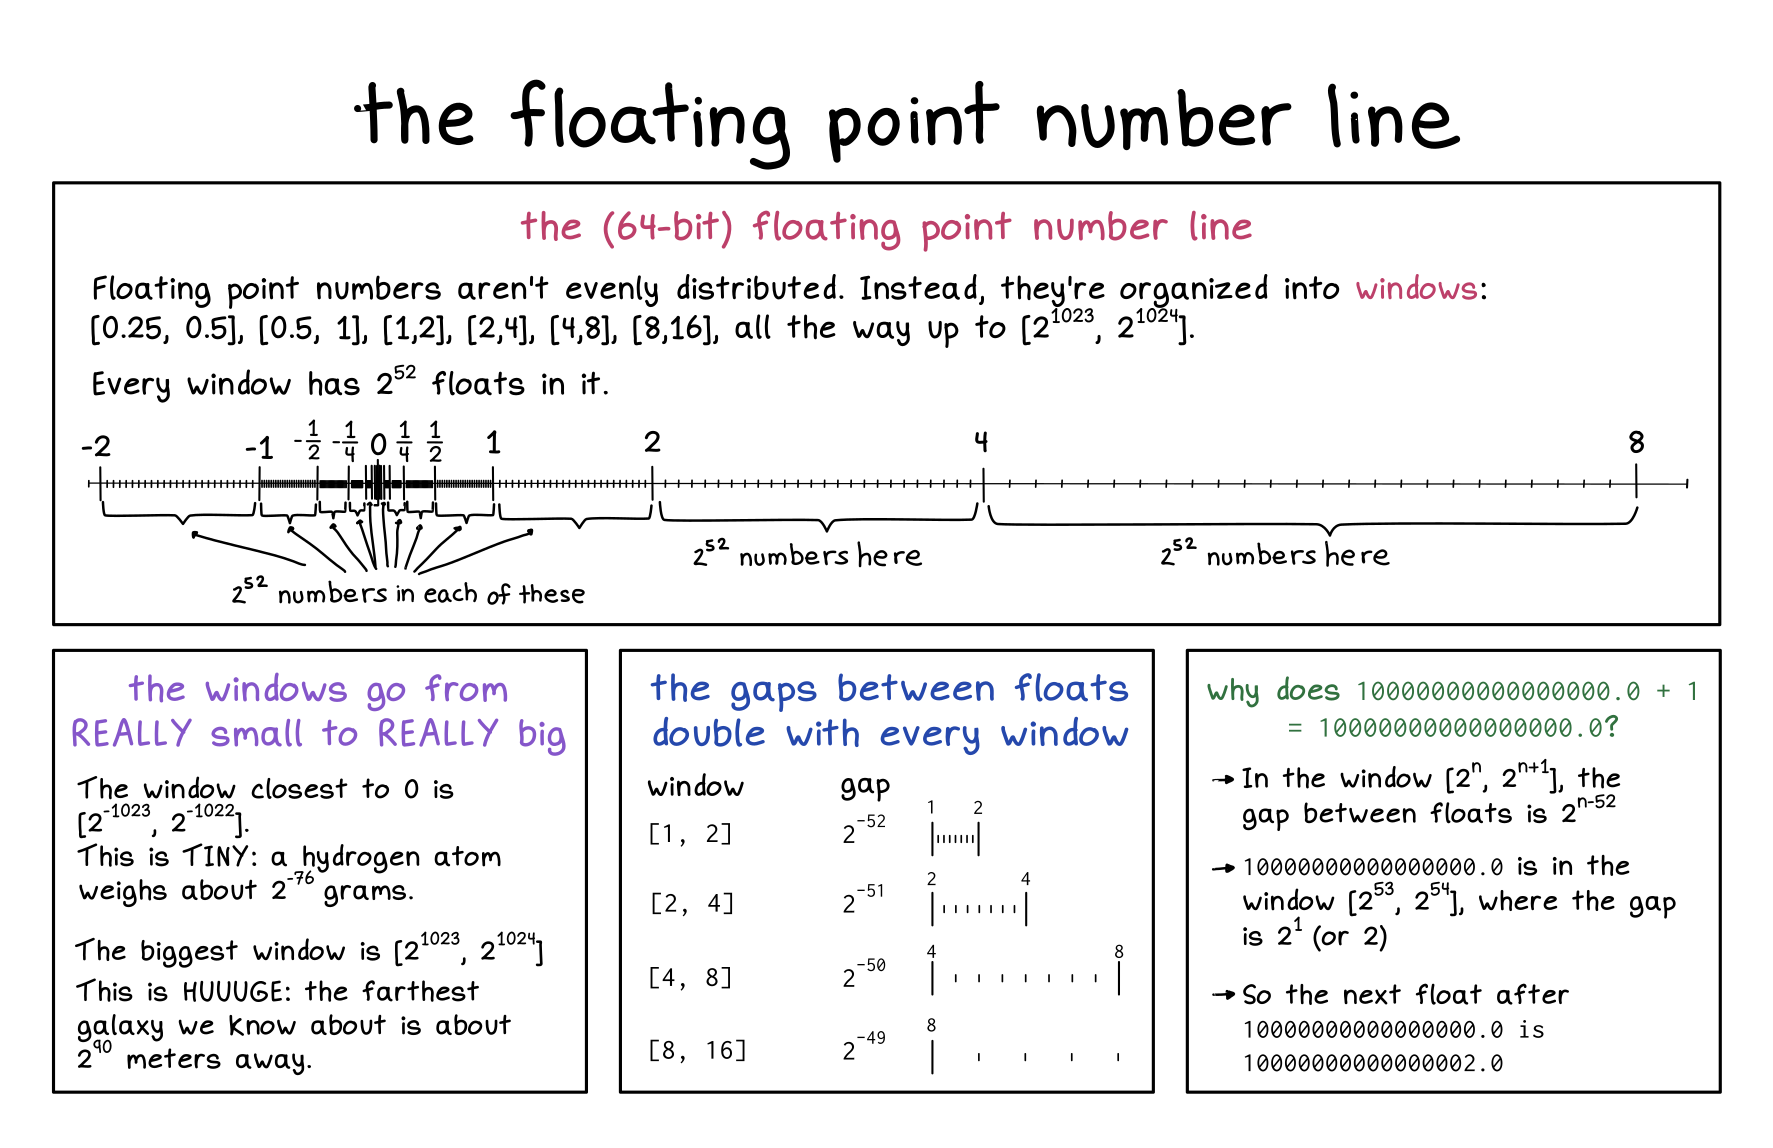
there are values that cannot be represented.
see a nan (which bits can be changd without making it not nan)
from 9007199254740992.0 the next closest value is 9007199254740994.0… no values in between can be stores in double precision float
We can see a few in this toy dataset
This data has some missing values
na_toy_df
| a | b | c | d | |
|---|---|---|---|---|
| 0 | 1.0 | 3.0 | 4.0 | 5.0 |
| 1 | 2.0 | 6.0 | NaN | NaN |
| 2 | NaN | NaN | NaN | NaN |
| 3 | NaN | 3.0 | 4.0 | 5.0 |
Let’s try the default behavior of dropna
na_toy_df.dropna()
| a | b | c | d | |
|---|---|---|---|---|
| 0 | 1.0 | 3.0 | 4.0 | 5.0 |
This is the same as
na_toy_df.dropna(how='any',subset=na_toy_df.columns,axis=0)
| a | b | c | d | |
|---|---|---|---|---|
| 0 | 1.0 | 3.0 | 4.0 | 5.0 |
by default it drops all of the rows where any of the elements are missing (1 or more)
we can change how to its other mode:
na_toy_df.dropna(how='all')
| a | b | c | d | |
|---|---|---|---|---|
| 0 | 1.0 | 3.0 | 4.0 | 5.0 |
| 1 | 2.0 | 6.0 | NaN | NaN |
| 3 | NaN | 3.0 | 4.0 | 5.0 |
in 'all' mode it only drops rows where all of the values are missing
we can also change it to work along columns (axis=1) instead
na_toy_df.dropna(how='all',axis=1)
| a | b | c | d | |
|---|---|---|---|---|
| 0 | 1.0 | 3.0 | 4.0 | 5.0 |
| 1 | 2.0 | 6.0 | NaN | NaN |
| 2 | NaN | NaN | NaN | NaN |
| 3 | NaN | 3.0 | 4.0 | 5.0 |
None of the columns are all missing so nothing is dropped
Let’s say we had an analysis where we neded at least one of column c or d or else we could not
use the row, we can check that this way:
na_toy_df.dropna(how='all',subset=['c','d']
  Cell In[9], line 1
    na_toy_df.dropna(how='all',subset=['c','d']
                                               ^
SyntaxError: unexpected EOF while parsing
8.3.1. Filling missing values#
Let’s look at a real dataset now
coffee_df.info()
<class 'pandas.core.frame.DataFrame'>
RangeIndex: 1311 entries, 0 to 1310
Data columns (total 44 columns):
 #   Column                 Non-Null Count  Dtype
---  ------                 --------------  -----
 0   Unnamed: 0             1311 non-null   int64
 1   Species                1311 non-null   object
 2   Owner                  1304 non-null   object
 3   Country.of.Origin      1310 non-null   object
 4   Farm.Name              955 non-null    object
 5   Lot.Number             270 non-null    object
 6   Mill                   1001 non-null   object
 7   ICO.Number             1163 non-null   object
 8   Company                1102 non-null   object
 9   Altitude               1088 non-null   object
 10  Region                 1254 non-null   object
 11  Producer               1081 non-null   object
 12  Number.of.Bags         1311 non-null   int64
 13  Bag.Weight             1311 non-null   object
 14  In.Country.Partner     1311 non-null   object
 15  Harvest.Year           1264 non-null   object
 16  Grading.Date           1311 non-null   object
 17  Owner.1                1304 non-null   object
 18  Variety                1110 non-null   object
 19  Processing.Method      1159 non-null   object
 20  Aroma                  1311 non-null   float64
 21  Flavor                 1311 non-null   float64
 22  Aftertaste             1311 non-null   float64
 23  Acidity                1311 non-null   float64
 24  Body                   1311 non-null   float64
 25  Balance                1311 non-null   float64
 26  Uniformity             1311 non-null   float64
 27  Clean.Cup              1311 non-null   float64
 28  Sweetness              1311 non-null   float64
 29  Cupper.Points          1311 non-null   float64
 30  Total.Cup.Points       1311 non-null   float64
 31  Moisture               1311 non-null   float64
 32  Category.One.Defects   1311 non-null   int64
 33  Quakers                1310 non-null   float64
 34  Color                  1044 non-null   object
 35  Category.Two.Defects   1311 non-null   int64
 36  Expiration             1311 non-null   object
 37  Certification.Body     1311 non-null   object
 38  Certification.Address  1311 non-null   object
 39  Certification.Contact  1311 non-null   object
 40  unit_of_measurement    1311 non-null   object
 41  altitude_low_meters    1084 non-null   float64
 42  altitude_high_meters   1084 non-null   float64
 43  altitude_mean_meters   1084 non-null   float64
dtypes: float64(16), int64(4), object(24)
memory usage: 450.8+ KB
The ‘Lot.Number’ has a lot of NaN values, how can we explore it?
We can look at the type:
coffee_df['Lot.Number'].dtype
dtype('O')
And we can look at the value counts.
coffee_df['Lot.Number'].value_counts()
Lot.Number
1                             18
020/17                         6
019/17                         5
2                              3
102                            3
                              ..
11/23/0696                     1
3-59-2318                      1
8885                           1
5055                           1
017-053-0211/ 017-053-0212     1
Name: count, Length: 221, dtype: int64
We see that a lot are ‘1’, maybe we know that when the data was collected, if the Farm only has one lot, some people recorded ‘1’ and others left it as missing. So we could fill in with 1:
coffee_df['Lot.Number'].fillna('1').head()
0    1
1    1
2    1
3    1
4    1
Name: Lot.Number, dtype: object
coffee_df['Lot.Number'].head()
0    NaN
1    NaN
2    NaN
3    NaN
4    NaN
Name: Lot.Number, dtype: object
Note that even after we called fillna we display it again and the original data is unchanged.
To save the filled in column, technically we have a few choices:
use the
inplaceparameter. This doesn’t offer performance advantages, but does It still copies the object, but then reassigns the pointer. Its under discussion to deprecatewrite to a new DataFrame
add a column
we will add a column
coffee_df['lot_number_clean'] = coffee_df['Lot.Number'].fillna('1')
coffee_df.head(1)
| Unnamed: 0 | Species | Owner | Country.of.Origin | Farm.Name | Lot.Number | Mill | ICO.Number | Company | Altitude | ... | Category.Two.Defects | Expiration | Certification.Body | Certification.Address | Certification.Contact | unit_of_measurement | altitude_low_meters | altitude_high_meters | altitude_mean_meters | lot_number_clean | |
|---|---|---|---|---|---|---|---|---|---|---|---|---|---|---|---|---|---|---|---|---|---|
| 0 | 1 | Arabica | metad plc | Ethiopia | metad plc | NaN | metad plc | 2014/2015 | metad agricultural developmet plc | 1950-2200 | ... | 0 | April 3rd, 2016 | METAD Agricultural Development plc | 309fcf77415a3661ae83e027f7e5f05dad786e44 | 19fef5a731de2db57d16da10287413f5f99bc2dd | m | 1950.0 | 2200.0 | 2075.0 | 1 |
1 rows × 45 columns
coffee_df.shape
(1311, 45)
8.4. Dropping#
Dropping is a good choice when you otherwise have a lot of data and the data is missing at random.
Dropping can be risky if it’s not missing at random. For example, if we saw in the coffee data that one of the scores was missing for all of the rows from one country, or even just missing more often in one country, that could bias our results.
here will will focus on how this impacts how much data we have:
coffee_df.dropna().shape
(130, 45)
we lose a lot this way.
We could instead tell it to only drop rows with NaN in a subset of the columns.
coffee_df.dropna(subset=['altitude_low_meters']).shape
(1084, 45)
Now, it drops any row with one or more NaN values in that column.
In the Open Policing Project Data Summary we saw that they made a summary information that showed which variables had at least 70% not missing values. We can similarly choose to keep only variables that have more than a specific threshold of data, using the thresh parameter and axis=1 to drop along columns.
n_rows, _ = coffee_df.shape
coffee_df.dropna(thresh=.7*n_rows, axis=1).shape
(1311, 44)
8.5. Inconsistent values#
This was one of the things that many of you anticipated or had observed. A useful way to investigate for this, is to use value_counts and sort them alphabetically by the values from the original data, so that similar ones will be consecutive in the list. Once we have the value_counts() Series, the values from the coffee_df become the index, so we use sort_index.
Let’s look at the in_country_partner column
coffee_df['In.Country.Partner'].value_counts().sort_index()
In.Country.Partner
AMECAFE                                                                                  205
Africa Fine Coffee Association                                                            49
Almacafé                                                                                 178
Asociacion Nacional Del Café                                                             155
Asociación Mexicana De Cafés y Cafeterías De Especialidad A.C.                             6
Asociación de Cafés Especiales de Nicaragua                                                8
Blossom Valley International                                                              58
Blossom Valley International\n                                                             1
Brazil Specialty Coffee Association                                                       67
Central De Organizaciones Productoras De Café y Cacao Del Perú - Central Café & Cacao      1
Centro Agroecológico del Café A.C.                                                         8
Coffee Quality Institute                                                                   7
Ethiopia Commodity Exchange                                                               18
Instituto Hondureño del Café                                                              60
Kenya Coffee Traders Association                                                          22
METAD Agricultural Development plc                                                        15
NUCOFFEE                                                                                  36
Salvadoran Coffee Council                                                                 11
Specialty Coffee Ass                                                                       1
Specialty Coffee Association                                                             295
Specialty Coffee Association of Costa Rica                                                42
Specialty Coffee Association of Indonesia                                                 10
Specialty Coffee Institute of Asia                                                        16
Tanzanian Coffee Board                                                                     6
Torch Coffee Lab Yunnan                                                                    2
Uganda Coffee Development Authority                                                       22
Yunnan Coffee Exchange                                                                    12
Name: count, dtype: int64
We can see there’s only one Blossom Valley International\n but 58 Blossom Valley International, the former is likely a typo, especially since \n is a special character for a newline. Similarly, with ‘Specialty Coffee Ass’ and ‘Specialty Coffee Association’.
partner_corrections = {'Blossom Valley International\n':'Blossom Valley International',
  'Specialty Coffee Ass':'Specialty Coffee Association'}
coffee_df['in_country_partner_clean'] = coffee_df['In.Country.Partner'].replace(
  to_replace=partner_corrections)
coffee_df['in_country_partner_clean'].value_counts().sort_index()
in_country_partner_clean
AMECAFE                                                                                  205
Africa Fine Coffee Association                                                            49
Almacafé                                                                                 178
Asociacion Nacional Del Café                                                             155
Asociación Mexicana De Cafés y Cafeterías De Especialidad A.C.                             6
Asociación de Cafés Especiales de Nicaragua                                                8
Blossom Valley International                                                              59
Brazil Specialty Coffee Association                                                       67
Central De Organizaciones Productoras De Café y Cacao Del Perú - Central Café & Cacao      1
Centro Agroecológico del Café A.C.                                                         8
Coffee Quality Institute                                                                   7
Ethiopia Commodity Exchange                                                               18
Instituto Hondureño del Café                                                              60
Kenya Coffee Traders Association                                                          22
METAD Agricultural Development plc                                                        15
NUCOFFEE                                                                                  36
Salvadoran Coffee Council                                                                 11
Specialty Coffee Association                                                             296
Specialty Coffee Association of Costa Rica                                                42
Specialty Coffee Association of Indonesia                                                 10
Specialty Coffee Institute of Asia                                                        16
Tanzanian Coffee Board                                                                     6
Torch Coffee Lab Yunnan                                                                    2
Uganda Coffee Development Authority                                                       22
Yunnan Coffee Exchange                                                                    12
Name: count, dtype: int64
8.6. Multiple values in a single column#
Let’s look at the column about the bag weights
coffee_df['Bag.Weight'].head()
0    60 kg
1    60 kg
2        1
3    60 kg
4    60 kg
Name: Bag.Weight, dtype: object
it has both the value and the units in a single column, which is not what we want.
This would be better in two separate columns
bag_df = coffee_df['Bag.Weight'].str.split(' ').apply(pd.Series).rename({0:'bag_weight_clean',
                                                                1:'bag_weight_unit'},
                                                              axis=1)
bag_df.head()
| bag_weight_clean | bag_weight_unit | |
|---|---|---|
| 0 | 60 | kg |
| 1 | 60 | kg |
| 2 | 1 | NaN |
| 3 | 60 | kg |
| 4 | 60 | kg |
This:
picks the column
treats it as a string with the pandas Series attribute
.struses base python
str.splitto split at' 'spaces and makes a listcasts each list to Series with
.apply(pd.Series)renames the resulting columns from being numbered to usable names
rename({0:'bag_weight_clean', 1:'bag_weight_unit'}, axis=1)
Tip
The .apply(pd.Series) works on dictionaries too (anything hte series constructor can take to its data parameter) so this
is good for json data
The following subsections break down the casting and string methods in more detail
8.6.1. String methods#
Python has a powerful string class. There is also an even more powerful string module
we only need the base str methods most of the time
example_str = 'kjksfjds sklfjsdl'
type(example_str)
str
Some helpful ones:
example_str.split()
['kjksfjds', 'sklfjsdl']
this gives a list
you can also change the separator
'phrases-with-hyphens'.split('-')
['phrases', 'with', 'hyphens']
there are also mehtods for chaning the case and other similar things. *Use these instead of implementing your own string operations!!
example_str.upper(), example_str.capitalize()
('KJKSFJDS SKLFJSDL', 'Kjksfjds sklfjsdl')
8.6.2. Casting Review#
If we have a variable that is not the type we want like this:
a='5'
we can check type
type(a)
str
and we can use the name of the type we want, as a function to cast it to the new type.
int(5)
5
and check
type(int(a))
int
8.7. Combining parts of dataframes#
bag_df.head()
| bag_weight_clean | bag_weight_unit | |
|---|---|---|
| 0 | 60 | kg |
| 1 | 60 | kg |
| 2 | 1 | NaN |
| 3 | 60 | kg |
| 4 | 60 | kg |
we can pass pd.concat and iterable of pandas objects (here a list of DataFrames) and it will, by default stack them vertically, or with axis=1 stack the horizontally
pd.concat([coffee_df,bag_df],axis=1)
| Unnamed: 0 | Species | Owner | Country.of.Origin | Farm.Name | Lot.Number | Mill | ICO.Number | Company | Altitude | ... | Certification.Address | Certification.Contact | unit_of_measurement | altitude_low_meters | altitude_high_meters | altitude_mean_meters | lot_number_clean | in_country_partner_clean | bag_weight_clean | bag_weight_unit | |
|---|---|---|---|---|---|---|---|---|---|---|---|---|---|---|---|---|---|---|---|---|---|
| 0 | 1 | Arabica | metad plc | Ethiopia | metad plc | NaN | metad plc | 2014/2015 | metad agricultural developmet plc | 1950-2200 | ... | 309fcf77415a3661ae83e027f7e5f05dad786e44 | 19fef5a731de2db57d16da10287413f5f99bc2dd | m | 1950.00 | 2200.00 | 2075.00 | 1 | METAD Agricultural Development plc | 60 | kg |
| 1 | 2 | Arabica | metad plc | Ethiopia | metad plc | NaN | metad plc | 2014/2015 | metad agricultural developmet plc | 1950-2200 | ... | 309fcf77415a3661ae83e027f7e5f05dad786e44 | 19fef5a731de2db57d16da10287413f5f99bc2dd | m | 1950.00 | 2200.00 | 2075.00 | 1 | METAD Agricultural Development plc | 60 | kg |
| 2 | 3 | Arabica | grounds for health admin | Guatemala | san marcos barrancas "san cristobal cuch | NaN | NaN | NaN | NaN | 1600 - 1800 m | ... | 36d0d00a3724338ba7937c52a378d085f2172daa | 0878a7d4b9d35ddbf0fe2ce69a2062cceb45a660 | m | 1600.00 | 1800.00 | 1700.00 | 1 | Specialty Coffee Association | 1 | NaN |
| 3 | 4 | Arabica | yidnekachew dabessa | Ethiopia | yidnekachew dabessa coffee plantation | NaN | wolensu | NaN | yidnekachew debessa coffee plantation | 1800-2200 | ... | 309fcf77415a3661ae83e027f7e5f05dad786e44 | 19fef5a731de2db57d16da10287413f5f99bc2dd | m | 1800.00 | 2200.00 | 2000.00 | 1 | METAD Agricultural Development plc | 60 | kg |
| 4 | 5 | Arabica | metad plc | Ethiopia | metad plc | NaN | metad plc | 2014/2015 | metad agricultural developmet plc | 1950-2200 | ... | 309fcf77415a3661ae83e027f7e5f05dad786e44 | 19fef5a731de2db57d16da10287413f5f99bc2dd | m | 1950.00 | 2200.00 | 2075.00 | 1 | METAD Agricultural Development plc | 60 | kg |
| ... | ... | ... | ... | ... | ... | ... | ... | ... | ... | ... | ... | ... | ... | ... | ... | ... | ... | ... | ... | ... | ... |
| 1306 | 1307 | Arabica | juan carlos garcia lopez | Mexico | el centenario | NaN | la esperanza, municipio juchique de ferrer, ve... | 1104328663 | terra mia | 900 | ... | 59e396ad6e22a1c22b248f958e1da2bd8af85272 | 0eb4ee5b3f47b20b049548a2fd1e7d4a2b70d0a7 | m | 900.00 | 900.00 | 900.00 | 1 | AMECAFE | 1 | kg |
| 1307 | 1308 | Arabica | myriam kaplan-pasternak | Haiti | 200 farms | NaN | coeb koperativ ekselsyo basen (350 members) | NaN | haiti coffee | ~350m | ... | 36d0d00a3724338ba7937c52a378d085f2172daa | 0878a7d4b9d35ddbf0fe2ce69a2062cceb45a660 | m | 350.00 | 350.00 | 350.00 | 1 | Specialty Coffee Association | 2 | kg |
| 1308 | 1309 | Arabica | exportadora atlantic, s.a. | Nicaragua | finca las marías | 017-053-0211/ 017-053-0212 | beneficio atlantic condega | 017-053-0211/ 017-053-0212 | exportadora atlantic s.a | 1100 | ... | b4660a57e9f8cc613ae5b8f02bfce8634c763ab4 | 7f521ca403540f81ec99daec7da19c2788393880 | m | 1100.00 | 1100.00 | 1100.00 | 017-053-0211/ 017-053-0212 | Instituto Hondureño del Café | 69 | kg |
| 1309 | 1310 | Arabica | juan luis alvarado romero | Guatemala | finca el limon | NaN | beneficio serben | 11/853/165 | unicafe | 4650 | ... | b1f20fe3a819fd6b2ee0eb8fdc3da256604f1e53 | 724f04ad10ed31dbb9d260f0dfd221ba48be8a95 | ft | 1417.32 | 1417.32 | 1417.32 | 1 | Asociacion Nacional Del Café | 1 | kg |
| 1310 | 1312 | Arabica | bismarck castro | Honduras | los hicaques | 103 | cigrah s.a de c.v. | 13-111-053 | cigrah s.a de c.v | 1400 | ... | b4660a57e9f8cc613ae5b8f02bfce8634c763ab4 | 7f521ca403540f81ec99daec7da19c2788393880 | m | 1400.00 | 1400.00 | 1400.00 | 103 | Instituto Hondureño del Café | 69 | kg |
1311 rows × 48 columns
8.8. Quantizing a variable#
Sometimes a variable is recorded continous, or close (like age in years, technically integers are discrete, but for wide enough range it is not very categorical) but we want to analyze it as if it is categorical.
We can add a new variable that is calculated from the original one.
Let’s say we want to categorize coffes as small, medium or large batch size based on
the quantiles for the 'Number.of.Bags' column.
First, we get an idea of the distribution with EDA to make our plan:
coffee_df_bags = pd.concat([coffee_df,bag_df],axis=1)
coffee_df_bags['Number.of.Bags'].describe()
count    1311.000000
mean      153.887872
std       129.733734
min         0.000000
25%        14.500000
50%       175.000000
75%       275.000000
max      1062.000000
Name: Number.of.Bags, dtype: float64
coffee_df_bags['Number.of.Bags'].hist()
<Axes: >
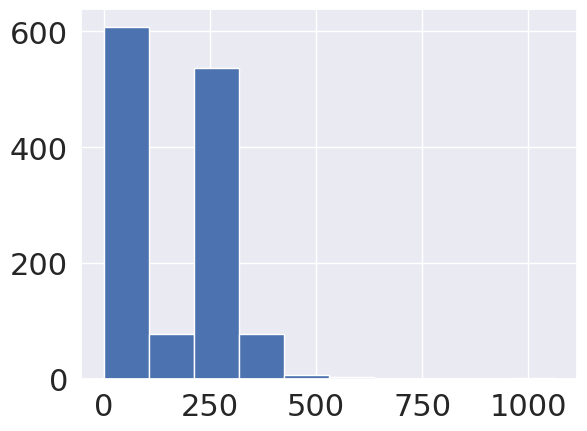
We see that most are small, but there is at least one major outlier, 75% are below 275, but the max is 1062.
We can use pd.cut to make discrete values
pd.cut(coffee_df_bags['Number.of.Bags'],bins=3).sample(10)
61      (-1.062, 354.0]
17      (-1.062, 354.0]
219     (-1.062, 354.0]
1182    (-1.062, 354.0]
856     (-1.062, 354.0]
169     (-1.062, 354.0]
546     (-1.062, 354.0]
960     (-1.062, 354.0]
1054    (-1.062, 354.0]
369     (-1.062, 354.0]
Name: Number.of.Bags, dtype: category
Categories (3, interval[float64, right]): [(-1.062, 354.0] < (354.0, 708.0] < (708.0, 1062.0]]
by default, it makes bins of equal size, meaning the range of values. This is not good based on what we noted above. Most will be in one label
Note
I would like to show a histogram here, but for somereason it broke. The output is hidden for now.
Show code cell source
pd.cut(coffee_df_bags['Number.of.Bags'],bins=3).hist()
---------------------------------------------------------------------------
TypeError                                 Traceback (most recent call last)
Cell In[38], line 1
----> 1 pd.cut(coffee_df_bags['Number.of.Bags'],bins=3).hist()

File /opt/hostedtoolcache/Python/3.8.18/x64/lib/python3.8/site-packages/pandas/plotting/_core.py:99, in hist_series(self, by, ax, grid, xlabelsize, xrot, ylabelsize, yrot, figsize, bins, backend, legend, **kwargs)
     50 """
     51 Draw histogram of the input series using matplotlib.
     52
   (...)
     96 matplotlib.axes.Axes.hist : Plot a histogram using matplotlib.
     97 """
     98 plot_backend = _get_plot_backend(backend)
---> 99 return plot_backend.hist_series(
    100     self,
    101     by=by,
    102     ax=ax,
    103     grid=grid,
    104     xlabelsize=xlabelsize,
    105     xrot=xrot,
    106     ylabelsize=ylabelsize,
    107     yrot=yrot,
    108     figsize=figsize,
    109     bins=bins,
    110     legend=legend,
    111     **kwargs,
    112 )

File /opt/hostedtoolcache/Python/3.8.18/x64/lib/python3.8/site-packages/pandas/plotting/_matplotlib/hist.py:425, in hist_series(self, by, ax, grid, xlabelsize, xrot, ylabelsize, yrot, figsize, bins, legend, **kwds)
    423 if legend:
    424     kwds["label"] = self.name
--> 425 ax.hist(values, bins=bins, **kwds)
    426 if legend:
    427     ax.legend()

File /opt/hostedtoolcache/Python/3.8.18/x64/lib/python3.8/site-packages/matplotlib/__init__.py:1446, in _preprocess_data.<locals>.inner(ax, data, *args, **kwargs)
   1443 @functools.wraps(func)
   1444 def inner(ax, *args, data=None, **kwargs):
   1445     if data is None:
-> 1446         return func(ax, *map(sanitize_sequence, args), **kwargs)
   1448     bound = new_sig.bind(ax, *args, **kwargs)
   1449     auto_label = (bound.arguments.get(label_namer)
   1450                   or bound.kwargs.get(label_namer))

File /opt/hostedtoolcache/Python/3.8.18/x64/lib/python3.8/site-packages/matplotlib/axes/_axes.py:6763, in Axes.hist(self, x, bins, range, density, weights, cumulative, bottom, histtype, align, orientation, rwidth, log, color, label, stacked, **kwargs)
   6759 for xi in x:
   6760     if len(xi):
   6761         # python's min/max ignore nan,
   6762         # np.minnan returns nan for all nan input
-> 6763         xmin = min(xmin, np.nanmin(xi))
   6764         xmax = max(xmax, np.nanmax(xi))
   6765 if xmin <= xmax:  # Only happens if we have seen a finite value.

TypeError: '<' not supported between instances of 'pandas._libs.interval.Interval' and 'float'
TO make it better, we can specify the bin edges instead of only the number
min_bags = coffee_df_bags['Number.of.Bags'].min()
sm_cutoff = coffee_df_bags['Number.of.Bags'].quantile(.33)
md_cutoff = coffee_df_bags['Number.of.Bags'].quantile(.66)
max_bags = coffee_df_bags['Number.of.Bags'].max()
pd.cut(coffee_df_bags['Number.of.Bags'],
        bins=[min_bags,sm_cutoff,md_cutoff,max_bags]).head()
0    (250.0, 1062.0]
1    (250.0, 1062.0]
2        (0.0, 28.0]
3    (250.0, 1062.0]
4    (250.0, 1062.0]
Name: Number.of.Bags, dtype: category
Categories (3, interval[float64, right]): [(0.0, 28.0] < (28.0, 250.0] < (250.0, 1062.0]]
here, we made cutoffs individually and pass them as a list to pd.cut
This is okay for 3 bins, but if we change our mind, it’s a lot of work to make more. Better is to make the bins more programmatically:
[coffee_df_bags['Number.of.Bags'].quantile(pct) for pct in np.linspace(0,1,4)]
[0.0, 29.0, 250.0, 1062.0]
np.linspace returns a numpyarray of evenly (linearly; there is also logspace) spaced
numbers. From the start to the end value for the number you specify. Here we said 4 evenly spaced from 0 to 1.
this is the same as we had before (up to rounding error)
[min_bags,sm_cutoff,md_cutoff,max_bags]
[0, 28.0, 250.0, 1062]
Now we can use these and optionally, change to text labels (which then means we have to update that too if we change the number 4 to another number, but still less work than above)
bag_num_bins = [coffee_df_bags['Number.of.Bags'].quantile(pct) for pct in np.linspace(0,1,4)]
pd.cut(coffee_df_bags['Number.of.Bags'],
        bins=bag_num_bins,labels = ['small','medium','large']).head()
0    large
1    large
2    small
3    large
4    large
Name: Number.of.Bags, dtype: category
Categories (3, object): ['small' < 'medium' < 'large']
we could then add this to the dataframe to work with it
8.9. Questions#
8.9.1. How can I rename without a dicionary#
Really, best practice is a dictionary or function, that is what rename uses.
You can assign to the columns attribute, but then you have to provide all of the column names
8.9.2. Why are strings object?#
it’s largely for backwards compatibility