Class 8: Visualization and Starting to Clean Data
Announcements
closing notebooks
recall that they don’t stop when you close the tabs
you need to stop it at the terminal it launched from
with: ctr + c as it says when you first launch a notebook
restart and rerun notebooks
notebooks are a continuous REPL as long as you have it open
if you change code, you could have, for example a variable that is no longer defined in the notebook as written, but that still exists in memory, so code that depends on it will still run, for now, but not after you restart next (eg if we run it while grading)
to check, restart and rerun your notebook
say hello on zoom for attendance
Setup
First we import packages and load data as normal.
import pandas as pd
import seaborn as sns

data_url = 'https://raw.githubusercontent.com/brownsarahm/python-socialsci-files/master/data/SAFI_full_shortname.csv'
sns.set(font_scale=1.25)
I’ve added one new command here, Seaborn’s []set function](https://seaborn.pydata.org/generated/seaborn.set.html). It sets a bunch of theme aspects for plotting, here I used it to increase the font size.
Warmup Activity
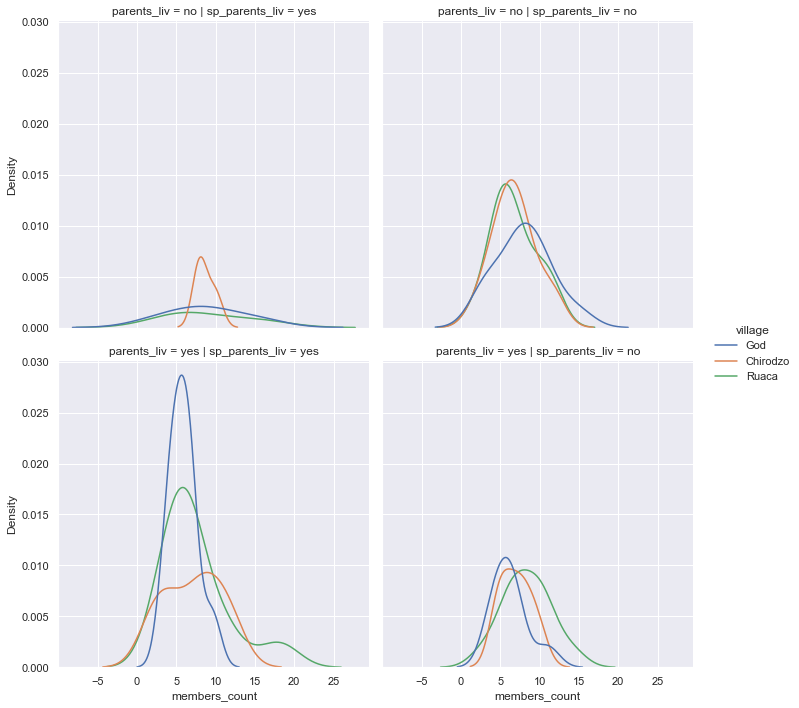
How recreate this plot?
First, load the data
safi_df = pd.read_csv(data_url)
This is a displot.
sns.displot(data=safi_df, x='members_count',row='parents_liv',
            col = 'sp_parents_liv',hue='village',kind='kde')
<seaborn.axisgrid.FacetGrid at 0x7f710ba0c690>
This allows comparisons of how the village, respondent’s parents living (parents_liv), and the spouse’s (sp_parents_liv) influence the number of members of the household (members_count). The kind='kde' parameter uses the underlying kdeplot to apply kernel density estimation
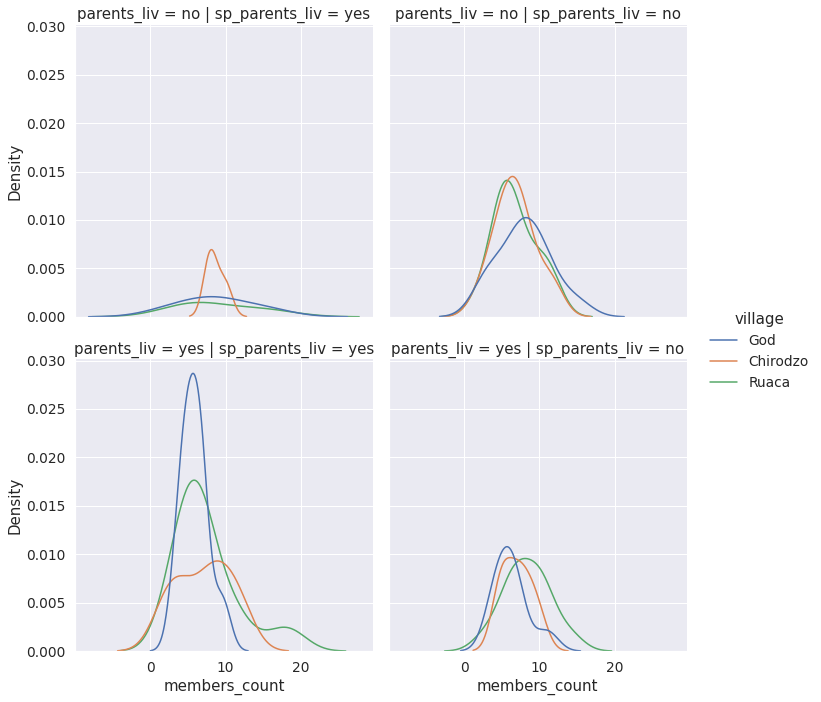
We can understand better what this does, by comparing what happens when we take it out.
sns.displot(data=safi_df, x='members_count',row='parents_liv',
            col = 'sp_parents_liv',hue='village')
<seaborn.axisgrid.FacetGrid at 0x7f70cab6fdd0>
What about the rest of the columns?
We’ve used this SAFI dataset a lot, but we’ve only used a few of the many columns. Let’s look at all of them.
safi_df.columns
Index(['key_id', 'interview_date', 'quest_no', 'start', 'end', 'province',
       'district', 'ward', 'village', 'years_farm', 'agr_assoc', 'note2',
       'no_membrs', 'members_count', 'remittance_money', 'years_liv',
       'parents_liv', 'sp_parents_liv', 'grand_liv', 'sp_grand_liv',
       'respondent_roof_type', 'respondent_wall_type',
       'respondent_wall_type_other', 'respondent_floor_type', 'window_type',
       'buildings_in_compound', 'rooms', 'other_buildings', 'no_plots',
       'plots_count', 'water_use', 'no_group_count', 'yes_group_count',
       'no_enough_water', 'months_no_water', 'period_use', 'exper_other',
       'other_meth', 'res_change', 'memb_assoc', 'resp_assoc', 'fees_water',
       'affect_conflicts', 'note', 'need_money', 'money_source',
       'money_source_other', 'crops_contr', 'emply_lab', 'du_labour',
       'liv_owned', 'liv_owned_other', 'liv_count', 'poultry',
       'du_look_aftr_cows', 'items_owned', 'items_owned_other', 'no_meals',
       'months_lack_food', 'no_food_mitigation', 'gps_Latitude',
       'gps_Longitude', 'gps_Altitude', 'gps_Accuracy', 'instanceID'],
      dtype='object')
We can look at the first few row to recall what sort of data are available in each column.
safi_df.head()
| key_id | interview_date | quest_no | start | end | province | district | ward | village | years_farm | ... | items_owned | items_owned_other | no_meals | months_lack_food | no_food_mitigation | gps_Latitude | gps_Longitude | gps_Altitude | gps_Accuracy | instanceID | |
|---|---|---|---|---|---|---|---|---|---|---|---|---|---|---|---|---|---|---|---|---|---|
| 0 | 1 | 17 November 2016 | 1 | 2017-03-23T09:49:57.000Z | 2017-04-02T17:29:08.000Z | Manica | Manica | Bandula | God | 11 | ... | ['bicycle' ; 'television' ; 'solar_panel' ; ... | NaN | 2 | ['Jan'] | ['na' ; 'rely_less_food' ; 'reduce_meals' ; ... | -19.112259 | 33.483456 | 698 | 14.0 | uuid:ec241f2c-0609-46ed-b5e8-fe575f6cefef |
| 1 | 2 | 17 November 2016 | 1 | 2017-04-02T09:48:16.000Z | 2017-04-02T17:26:19.000Z | Manica | Manica | Bandula | God | 2 | ... | ['cow_cart' ; 'bicycle' ; 'radio' ; 'cow_pl... | NaN | 2 | ['Jan' ; 'Sept' ; 'Oct' ; 'Nov' ; 'Dec'] | ['na' ; 'reduce_meals' ; 'restrict_adults' ;... | -19.112477 | 33.483416 | 690 | 19.0 | uuid:099de9c9-3e5e-427b-8452-26250e840d6e |
| 2 | 3 | 17 November 2016 | 3 | 2017-04-02T14:35:26.000Z | 2017-04-02T17:26:53.000Z | Manica | Manica | Bandula | God | 40 | ... | ['solar_torch'] | NaN | 2 | ['Jan' ; 'Feb' ; 'Mar' ; 'Oct' ; 'Nov' ; ... | ['na' ; 'restrict_adults' ; 'lab_ex_food'] | -19.112108 | 33.483450 | 674 | 13.0 | uuid:193d7daf-9582-409b-bf09-027dd36f9007 |
| 3 | 4 | 17 November 2016 | 4 | 2017-04-02T14:55:18.000Z | 2017-04-02T17:27:16.000Z | Manica | Manica | Bandula | God | 6 | ... | ['bicycle' ; 'radio' ; 'cow_plough' ; 'sola... | NaN | 2 | ['Sept' ; 'Oct' ; 'Nov' ; 'Dec'] | ['na' ; 'reduce_meals' ; 'restrict_adults' ;... | -19.112229 | 33.483424 | 679 | 5.0 | uuid:148d1105-778a-4755-aa71-281eadd4a973 |
| 4 | 5 | 17 November 2016 | 5 | 2017-04-02T15:10:35.000Z | 2017-04-02T17:27:35.000Z | Manica | Manica | Bandula | God | 18 | ... | ['motorcyle' ; 'radio' ; 'cow_plough' ; 'mo... | NaN | 2 | ['Aug' ; 'Sept' ; 'Oct' ; 'Nov'] | ['na' ; 'go_forest' ; 'migrate'] | -19.112217 | 33.483425 | 689 | 10.0 | uuid:2c867811-9696-4966-9866-f35c3e97d02d |
5 rows × 65 columns
It might be interesting to use the items_owned column to compare find out if there are differences between farms based on what items they have.
Maybe we’d want to see how many farms own each item, maybe we want to know how many farms own bicycle. Let’s try value_counts out like we used before.
safi_df['items_owned'].value_counts()
['radio']                                                                                                                           4
['mobile_phone']                                                                                                                    4
['bicycle' ;  'radio' ;  'cow_plough' ;  'solar_panel' ;  'table' ;  'mobile_phone']                                                3
['bicycle' ;  'radio' ;  'mobile_phone']                                                                                            3
['bicycle' ;  'radio' ;  'cow_plough' ;  'solar_panel' ;  'solar_torch' ;  'mobile_phone']                                          3
                                                                                                                                   ..
['radio' ;  'cow_plough' ;  'table' ;  'mobile_phone']                                                                              1
['motorcyle' ;  'television' ;  'radio' ;  'cow_plough' ;  'solar_panel' ;  'mobile_phone']                                         1
['radio' ;  'table' ;  'sofa_set' ;  'mobile_phone']                                                                                1
['cow_cart' ;  'motorcyle' ;  'bicycle' ;  'television' ;  'radio' ;  'cow_plough' ;  'solar_panel' ;  'solar_torch' ;  'table']    1
['motorcyle' ;  'bicycle' ;  'radio' ;  'table' ;  'mobile_phone']                                                                  1
Name: items_owned, Length: 95, dtype: int64
The problem is this gives the count of each list of items instead of each item. What we’d want instead is one column for each item, where the values in the column are 1 when the farm owns that item and 0 when they don’t. This representation is sometimes called 1 hot encoding and other times (including in pandas) it’s called dummy variables.
Using Dummy Variables
Let’s try this function out, first on the village column.
pd.get_dummies(data= safi_df,columns=['village'])
| key_id | interview_date | quest_no | start | end | province | district | ward | years_farm | agr_assoc | ... | months_lack_food | no_food_mitigation | gps_Latitude | gps_Longitude | gps_Altitude | gps_Accuracy | instanceID | village_Chirodzo | village_God | village_Ruaca | |
|---|---|---|---|---|---|---|---|---|---|---|---|---|---|---|---|---|---|---|---|---|---|
| 0 | 1 | 17 November 2016 | 1 | 2017-03-23T09:49:57.000Z | 2017-04-02T17:29:08.000Z | Manica | Manica | Bandula | 11 | no | ... | ['Jan'] | ['na' ; 'rely_less_food' ; 'reduce_meals' ; ... | -19.112259 | 33.483456 | 698 | 14.0 | uuid:ec241f2c-0609-46ed-b5e8-fe575f6cefef | 0 | 1 | 0 |
| 1 | 2 | 17 November 2016 | 1 | 2017-04-02T09:48:16.000Z | 2017-04-02T17:26:19.000Z | Manica | Manica | Bandula | 2 | yes | ... | ['Jan' ; 'Sept' ; 'Oct' ; 'Nov' ; 'Dec'] | ['na' ; 'reduce_meals' ; 'restrict_adults' ;... | -19.112477 | 33.483416 | 690 | 19.0 | uuid:099de9c9-3e5e-427b-8452-26250e840d6e | 0 | 1 | 0 |
| 2 | 3 | 17 November 2016 | 3 | 2017-04-02T14:35:26.000Z | 2017-04-02T17:26:53.000Z | Manica | Manica | Bandula | 40 | no | ... | ['Jan' ; 'Feb' ; 'Mar' ; 'Oct' ; 'Nov' ; ... | ['na' ; 'restrict_adults' ; 'lab_ex_food'] | -19.112108 | 33.483450 | 674 | 13.0 | uuid:193d7daf-9582-409b-bf09-027dd36f9007 | 0 | 1 | 0 |
| 3 | 4 | 17 November 2016 | 4 | 2017-04-02T14:55:18.000Z | 2017-04-02T17:27:16.000Z | Manica | Manica | Bandula | 6 | no | ... | ['Sept' ; 'Oct' ; 'Nov' ; 'Dec'] | ['na' ; 'reduce_meals' ; 'restrict_adults' ;... | -19.112229 | 33.483424 | 679 | 5.0 | uuid:148d1105-778a-4755-aa71-281eadd4a973 | 0 | 1 | 0 |
| 4 | 5 | 17 November 2016 | 5 | 2017-04-02T15:10:35.000Z | 2017-04-02T17:27:35.000Z | Manica | Manica | Bandula | 18 | no | ... | ['Aug' ; 'Sept' ; 'Oct' ; 'Nov'] | ['na' ; 'go_forest' ; 'migrate'] | -19.112217 | 33.483425 | 689 | 10.0 | uuid:2c867811-9696-4966-9866-f35c3e97d02d | 0 | 1 | 0 |
| ... | ... | ... | ... | ... | ... | ... | ... | ... | ... | ... | ... | ... | ... | ... | ... | ... | ... | ... | ... | ... | ... |
| 126 | 127 | 18 May 2017 | 126 | 2017-05-18T04:13:37.000Z | 2017-05-18T04:35:47.000Z | Manica | Manica | Bandula | 5 | yes | ... | ['Oct' ; 'Nov' ; 'Dec'] | ['rely_less_food' ; 'lab_ex_food'] | -19.112194 | 33.483379 | 700 | 7.0 | uuid:69caea81-a4e5-4e8d-83cd-9c18d8e8d965 | 0 | 0 | 1 |
| 127 | 128 | 04 June 2017 | 193 | 2017-06-04T09:36:20.000Z | 2017-06-04T10:13:32.000Z | Manica | Manica | Bandula | 10 | no | ... | ['none'] | ['na'] | -19.112157 | 33.483390 | 720 | 9.0 | uuid:5ccc2e5a-ea90-48b5-8542-69400d5334df | 0 | 0 | 1 |
| 128 | 129 | 04 June 2017 | 194 | 2017-06-04T10:13:36.000Z | 2017-06-04T10:32:06.000Z | Manica | Manica | Bandula | 5 | no | ... | ['Sept' ; 'Oct' ; 'Nov'] | ['lab_ex_food'] | -19.112271 | 33.483471 | 719 | 10.0 | uuid:95c11a30-d44f-40c4-8ea8-ec34fca6bbbf | 0 | 0 | 1 |
| 129 | 130 | 04 June 2017 | 199 | 2017-06-04T10:33:55.000Z | 2017-06-04T10:52:22.000Z | Manica | Manica | Bandula | 17 | yes | ... | ['Nov' ; 'Dec'] | ['rely_less_food' ; 'limit_variety' ; 'reduc... | -19.112278 | 33.483390 | 711 | 5.0 | uuid:ffc83162-ff24-4a87-8709-eff17abc0b3b | 1 | 0 | 0 |
| 130 | 131 | 04 June 2017 | 200 | 2017-06-04T10:52:46.000Z | 2017-06-04T11:08:13.000Z | Manica | Manica | Bandula | 20 | yes | ... | ['Oct' ; 'Nov'] | ['rely_less_food' ; 'restrict_adults' ; 'bor... | -19.112183 | 33.483372 | 681 | 20.0 | uuid:aa77a0d7-7142-41c8-b494-483a5b68d8a7 | 1 | 0 | 0 |
131 rows × 67 columns
Instead of scrolling, we can isolate the new columns we just created.
safi_df_villages = pd.get_dummies(data= safi_df,columns=['village'])
keep_cols = [col for col in safi_df_villages.columns if 'village_' in col]
safi_df_villages[keep_cols]
| village_Chirodzo | village_God | village_Ruaca | |
|---|---|---|---|
| 0 | 0 | 1 | 0 |
| 1 | 0 | 1 | 0 |
| 2 | 0 | 1 | 0 |
| 3 | 0 | 1 | 0 |
| 4 | 0 | 1 | 0 |
| ... | ... | ... | ... |
| 126 | 0 | 0 | 1 |
| 127 | 0 | 0 | 1 |
| 128 | 0 | 0 | 1 |
| 129 | 1 | 0 | 0 |
| 130 | 1 | 0 | 0 |
131 rows × 3 columns
Note that now we have 3 columns, one for each village. This column was already usable, but it was well formatted an useful to illustrate what get_dummies does.
Note
try this out and compare the two, test out get_dummies on another column to be sure you know what it does.
Now, we can try it on items_owned.
_this time we’ll filter the columns for display and inspection right away
safi_df_items = pd.get_dummies(data= safi_df,columns=['items_owned'])
keep_cols = [col for col in safi_df_items.columns if 'village_' in col]
safi_df_items[keep_cols]
| 0 |
|---|
| 1 |
| 2 |
| 3 |
| 4 |
| ... |
| 126 |
| 127 |
| 128 |
| 129 |
| 130 |
131 rows × 0 columns
This still isn’t quite what we want, because each value in the items_owned column looks like a list but it’s actually a string, we can check that with the type function.
type(safi_df['items_owned'][0])
str
Cleaning One Cell of Data
So, let’s clean the value from one cell of that column and see what else is going on. First, we save it to a variable.
farm1_items = safi_df['items_owned'][0]
Let’s look at it first.
farm1_items
"['bicycle' ; 'television' ; 'solar_panel' ; 'table']"
We could try first casting it to a list.
list(farm1_items)
['[',
 "'",
 'b',
 'i',
 'c',
 'y',
 'c',
 'l',
 'e',
 "'",
 ' ',
 ';',
 ' ',
 ' ',
 "'",
 't',
 'e',
 'l',
 'e',
 'v',
 'i',
 's',
 'i',
 'o',
 'n',
 "'",
 ' ',
 ';',
 ' ',
 ' ',
 "'",
 's',
 'o',
 'l',
 'a',
 'r',
 '_',
 'p',
 'a',
 'n',
 'e',
 'l',
 "'",
 ' ',
 ';',
 ' ',
 ' ',
 "'",
 't',
 'a',
 'b',
 'l',
 'e',
 "'",
 ']']
That doesn’t quite do it though, let’s try separating it with the split method at the ‘;’.
farm1_items.split(';')
["['bicycle' ", " 'television' ", " 'solar_panel' ", " 'table']"]
This still has some extra characters, in it though. We should remove those, probably before we do the split so that we don’t end up with empty items in the list.
farm1_items.replace('[','').replace(']','').replace("'","")
'bicycle ; television ; solar_panel ; table'
That is now ready to split.
farm1_items.replace('[','').replace(']','').replace("'","").split(';')
['bicycle ', ' television ', ' solar_panel ', ' table']
There are some empty spaces lest. Python has a string function strip that removes leading and trailing (on the ends) whitespace (spaces, tabs, new lines), we have to apply it to each individual item of that list above. We can use a list comprehension for this.
[i.strip() for i in farm1_items.replace('[','').replace(']','').replace("'","").split(';')]
['bicycle', 'television', 'solar_panel', 'table']
Applying this to the rest of the data
We can put that in a function so that we can reuse it.
def separate_items(row):
    '''
    clean the items owned column of one row of the safi_df
    '''

    return [i.strip() for i in  row['items_owned'].replace('[','').replace(']','').replace("'","").split(';')]
Pandas provides us special function to apply a function to a dataframe along a given axis.
safi_df.apply(separate_items,axis=1)
---------------------------------------------------------------------------
AttributeError                            Traceback (most recent call last)
<ipython-input-20-26c2d810f773> in <module>
----> 1 safi_df.apply(separate_items,axis=1)

/opt/hostedtoolcache/Python/3.7.10/x64/lib/python3.7/site-packages/pandas/core/frame.py in apply(self, func, axis, raw, result_type, args, **kwds)
   7766             kwds=kwds,
   7767         )
-> 7768         return op.get_result()
   7769
   7770     def applymap(self, func, na_action: Optional[str] = None) -> DataFrame:

/opt/hostedtoolcache/Python/3.7.10/x64/lib/python3.7/site-packages/pandas/core/apply.py in get_result(self)
    183             return self.apply_raw()
    184
--> 185         return self.apply_standard()
    186
    187     def apply_empty_result(self):

/opt/hostedtoolcache/Python/3.7.10/x64/lib/python3.7/site-packages/pandas/core/apply.py in apply_standard(self)
    274
    275     def apply_standard(self):
--> 276         results, res_index = self.apply_series_generator()
    277
    278         # wrap results

/opt/hostedtoolcache/Python/3.7.10/x64/lib/python3.7/site-packages/pandas/core/apply.py in apply_series_generator(self)
    288             for i, v in enumerate(series_gen):
    289                 # ignore SettingWithCopy here in case the user mutates
--> 290                 results[i] = self.f(v)
    291                 if isinstance(results[i], ABCSeries):
    292                     # If we have a view on v, we need to make a copy because

<ipython-input-19-f7c175567037> in separate_items(row)
      4     '''
      5
----> 6     return [i.strip() for i in  row['items_owned'].replace('[','').replace(']','').replace("'","").split(';')]
      7

AttributeError: 'float' object has no attribute 'replace'
This error means that there are some elements of that column that is a float instead of a string. We should check what that might be. We can check with a list comprehension and look at the ones that are float
[item_list for item_list in safi_df['items_owned'] if type(item_list)==float]
[nan, nan, nan, nan, nan, nan, nan, nan, nan, nan]
Since the floats are nan, we know that our function more or less is the right thing to do, but we need to modify our function to accommodate those values. We can replace them with an empty list.
def separate_items(row):
    '''
    '''
    if type(row['items_owned'])==str:
        return [i.strip() for i in  row['items_owned'].replace('[','').replace(']','').replace("'","").split(';')]
    else:
        return []
We can try this again:
safi_df['items_owned_clean'] = safi_df.apply(separate_items,axis=1)
it runs successfully and we can look at the output.
safi_df[['items_owned_clean']].head()
| items_owned_clean | |
|---|---|
| 0 | [bicycle, television, solar_panel, table] |
| 1 | [cow_cart, bicycle, radio, cow_plough, solar_p... |
| 2 | [solar_torch] |
| 3 | [bicycle, radio, cow_plough, solar_panel, mobi... |
| 4 | [motorcyle, radio, cow_plough, mobile_phone] |
This looks all good and we’ll pick up from here on Monday.