Class 17: Evaluating Classification and Midsemester Feedback
share your favorite rainy day activity (or just say hi) in the zoom chat for attendance
log onto prismia
Naive Bayes Review
Main assumptions:
classification assumes that features will separate the gorups
NB: conditionally independent
# %load http://drsmb.co/310
import pandas as pd
import seaborn as sns
import numpy as np
from sklearn.model_selection import train_test_split
from sklearn.naive_bayes import GaussianNB
iris = sns.load_dataset("iris")
iris.head()
| sepal_length | sepal_width | petal_length | petal_width | species | |
|---|---|---|---|---|---|
| 0 | 5.1 | 3.5 | 1.4 | 0.2 | setosa |
| 1 | 4.9 | 3.0 | 1.4 | 0.2 | setosa |
| 2 | 4.7 | 3.2 | 1.3 | 0.2 | setosa |
| 3 | 4.6 | 3.1 | 1.5 | 0.2 | setosa |
| 4 | 5.0 | 3.6 | 1.4 | 0.2 | setosa |
X_train, X_test, y_train, y_test = train_test_split(iris.values[:,:4],
                                                    iris.species.values,
                                                    test_size=0.5, random_state=0)
gnb = GaussianNB()
y_pred = gnb.fit(X_train, y_train).predict(X_test)
y_pred
array(['virginica', 'versicolor', 'setosa', 'virginica', 'setosa',
       'virginica', 'setosa', 'versicolor', 'versicolor', 'versicolor',
       'versicolor', 'versicolor', 'versicolor', 'versicolor',
       'versicolor', 'setosa', 'versicolor', 'versicolor', 'setosa',
       'setosa', 'virginica', 'versicolor', 'setosa', 'setosa',
       'virginica', 'setosa', 'setosa', 'versicolor', 'versicolor',
       'setosa', 'virginica', 'versicolor', 'setosa', 'virginica',
       'virginica', 'versicolor', 'setosa', 'versicolor', 'versicolor',
       'versicolor', 'virginica', 'setosa', 'virginica', 'setosa',
       'setosa', 'versicolor', 'virginica', 'virginica', 'versicolor',
       'virginica', 'versicolor', 'virginica', 'versicolor', 'versicolor',
       'virginica', 'versicolor', 'versicolor', 'virginica', 'versicolor',
       'virginica', 'versicolor', 'setosa', 'virginica', 'versicolor',
       'versicolor', 'versicolor', 'versicolor', 'virginica', 'setosa',
       'setosa', 'virginica', 'versicolor', 'setosa', 'setosa',
       'versicolor'], dtype='<U10')
y_test
array(['virginica', 'versicolor', 'setosa', 'virginica', 'setosa',
       'virginica', 'setosa', 'versicolor', 'versicolor', 'versicolor',
       'virginica', 'versicolor', 'versicolor', 'versicolor',
       'versicolor', 'setosa', 'versicolor', 'versicolor', 'setosa',
       'setosa', 'virginica', 'versicolor', 'setosa', 'setosa',
       'virginica', 'setosa', 'setosa', 'versicolor', 'versicolor',
       'setosa', 'virginica', 'versicolor', 'setosa', 'virginica',
       'virginica', 'versicolor', 'setosa', 'versicolor', 'versicolor',
       'versicolor', 'virginica', 'setosa', 'virginica', 'setosa',
       'setosa', 'versicolor', 'virginica', 'virginica', 'virginica',
       'virginica', 'versicolor', 'virginica', 'versicolor', 'versicolor',
       'virginica', 'virginica', 'virginica', 'virginica', 'versicolor',
       'virginica', 'versicolor', 'setosa', 'virginica', 'versicolor',
       'versicolor', 'versicolor', 'versicolor', 'virginica', 'setosa',
       'setosa', 'virginica', 'versicolor', 'setosa', 'setosa',
       'versicolor'], dtype=object)
sum(y_pred == y_test)
71
len(y_pred)
75
Evaluating Classification
We can use the score method to compute accuracy by providing both features and target for the test set.
gnb.score(X_test, y_test)
0.9466666666666667
Which is the same as the manual way we did before
sum(y_pred == y_test)/len(y_pred)
0.9466666666666667
Scikit learn also provides a whole metrics module. We’ll look at two functions from it today.
from sklearn.metrics import confusion_matrix, classification_report
First a Confusion matrix, which is the basic table of how the decisions were made. It counts how many from each true class were predicted to be in each class. My favorite refernce on these is the table on the wikipedia article.
confusion_matrix(y_test,y_pred,)
array([[21,  0,  0],
       [ 0, 30,  0],
       [ 0,  4, 20]])
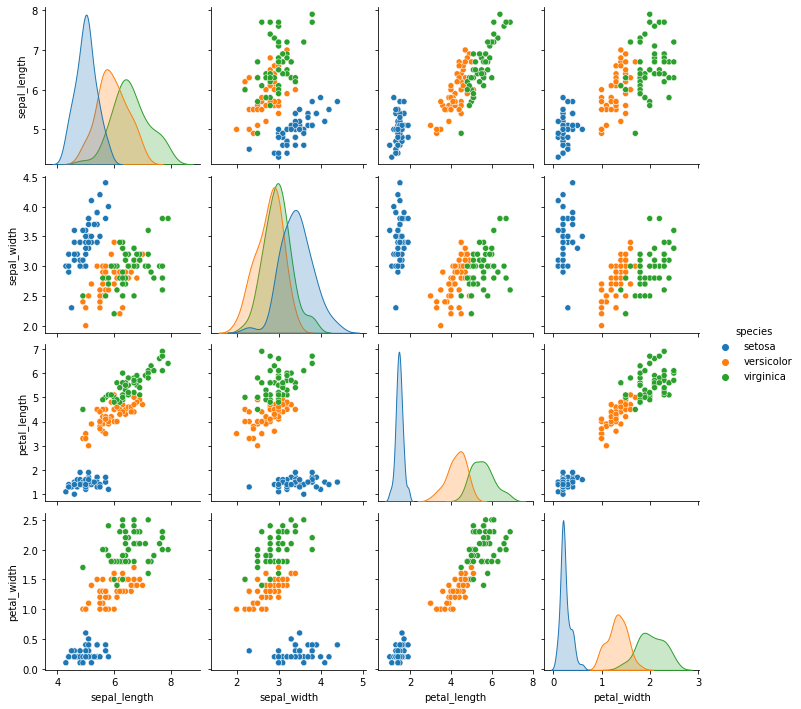
We can see this makes sense from looking at the data.
sns.pairplot(data =iris, hue='species')
<seaborn.axisgrid.PairGrid at 0x7f3233337210>

We can also get a formatted report that uses the confusion matrix to compute multiple metrics
print(classification_report(y_test,y_pred))
              precision    recall  f1-score   support

      setosa       1.00      1.00      1.00        21
  versicolor       0.88      1.00      0.94        30
   virginica       1.00      0.83      0.91        24

    accuracy                           0.95        75
   macro avg       0.96      0.94      0.95        75
weighted avg       0.95      0.95      0.95        75
Inspecting a classifier
We can serialize any python object to inspect it with __dict__
gnb.__dict__
{'priors': None,
 'var_smoothing': 1e-09,
 'n_features_in_': 4,
 'epsilon_': 3.6399040000000003e-09,
 'classes_': array(['setosa', 'versicolor', 'virginica'], dtype='<U10'),
 'theta_': array([[4.97586207, 3.35862069, 1.44827586, 0.23448276],
        [5.935     , 2.71      , 4.185     , 1.3       ],
        [6.77692308, 3.09230769, 5.73461538, 2.10769231]]),
 'sigma_': array([[0.10321047, 0.13208086, 0.01629013, 0.00846612],
        [0.256275  , 0.0829    , 0.255275  , 0.046     ],
        [0.38869823, 0.10147929, 0.31303255, 0.04763314]]),
 'class_count_': array([29., 20., 26.]),
 'class_prior_': array([0.38666667, 0.26666667, 0.34666667])}
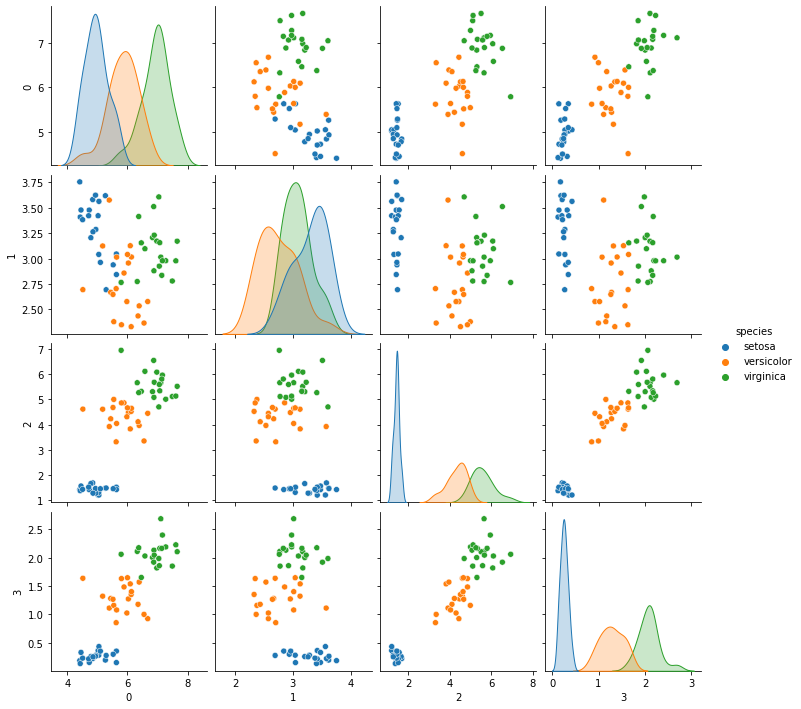
It includes attributes theta_ and sigma_ these characterize the mean and the variance of each class. Naive Bayes is a generative classifier, since we’re using the Guassian NB, it means it assumes that the data are Gaussian in each class. For a generative classifier, we can draw synthetic data from the model it learned. We can use this to decide if what it learned makes sense by comparing it qualitatively (or statistically) to the real data.
# %load http://drsmb.co/310
gnb_df = pd.DataFrame(np.concatenate([np.random.multivariate_normal(mu, sig*np.eye(4),20)
                                  for mu, sig in zip(gnb.theta_,gnb.sigma_)]))
gnb_df['species'] = [ci for cl in [[c]*20 for c in gnb.classes_] for ci in cl]
sns.pairplot(data =gnb_df, hue='species')
<seaborn.axisgrid.PairGrid at 0x7f322e750910>

Feedback
Please complete this feedback survey to provide input on how the semester is going for you so far.
More practice
Try breaking down all the steps that are in the last cell one by one to understand them.
Read the documentation for naive bayes, how does it use the model parameters to make a prediction?
