Class 24: Clustering
Log onto prismia
Say hello on Zoom
# %load http://drsmb.co/310
import matplotlib.pyplot as plt
import numpy as np
import seaborn as sns
from sklearn import datasets
from sklearn.cluster import KMeans
import string
import pandas as pd
How Does Kmeans work?
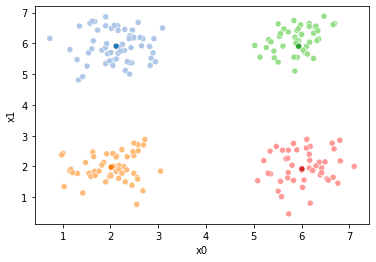
We’ll start with the data from dataset5 in assignment 6.
C = 4
N = 200
classes = list(string.ascii_uppercase[:C])
mu = {c: i for c, i in zip(classes,[[2,2, 2,2], [6,6,6,6], [2,6,6,2],[6,2,2,6]])}
sigma = {c: i*.5 for c, i in zip(classes,np.random.random(4))}
sigma

target5 = np.random.choice(classes,N)
data5 = [np.random.multivariate_normal(mu[c],.25*np.eye(C)) for c in target5]
df5 = pd.DataFrame(data = data5,columns = ['x' + str(i) for i in range(C)]).round(2)
rand_target = np.random.choice(classes,N)
obs_target = [np.random.choice([t,r],p=[.85,.15]) for t,r in zip(target5,rand_target)]
df5['char_noisy'] = obs_target
df5['char'] = target5

sns.pairplot(data =df5, hue='char')
<seaborn.axisgrid.PairGrid at 0x7fbe38702d90>
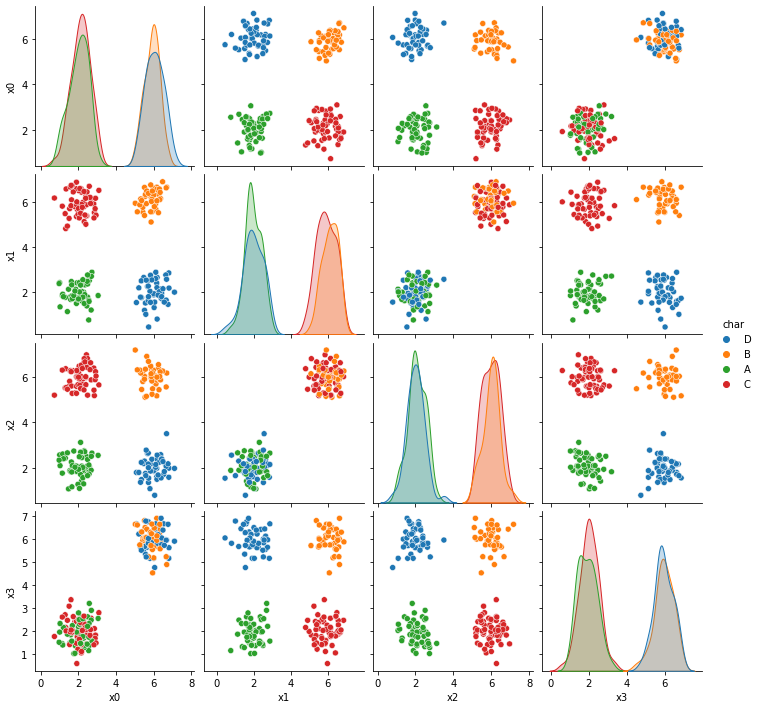
We’ll work with just two columns and the true labels
data_cols = ['x0','x1']
df = df5[data_cols]
df.head()
| x0 | x1 | |
|---|---|---|
| 0 | 6.80 | 2.85 |
| 1 | 5.90 | 6.42 |
| 2 | 6.37 | 2.14 |
| 3 | 2.17 | 1.62 |
| 4 | 1.90 | 6.86 |
We’ll also setup some things for making our plots how we’d like in advance
def mu_to_df(mu,i):
    mu_df = pd.DataFrame(mu,columns=data_cols)
    mu_df['iteration'] = str(i)
    mu_df['class'] = ['M'+str(i) for i in range(K)]
    mu_df['type'] = 'mu'
    return mu_df

cmap_pt = sns.color_palette('tab20',8)[1::2]
cmap_mu = sns.color_palette('tab20',8)[0::2]
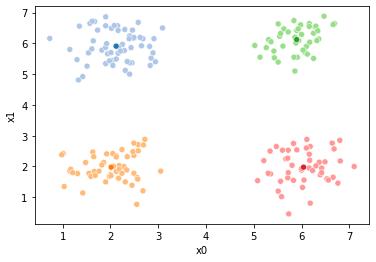
Now, we’ll start our clustering. First we set how many clusters we ant and then we’ll try out randomly assigning the samples and see where that puts the means
K = 4

df['0'] = np.random.choice(K,size=N)
sfig = sns.scatterplot(data =df,x='x0',y='x1',hue='0',palette=cmap_pt,legend=False)

mu = df.groupby('0')[data_cols].mean().values
mu_df = mu_to_df(mu,0)

# sns.scatterplot(data =mu_df,x='x0',y='x1',hue='class',palette=cmap_mu,ax=sfig,legend=False)
sfig.get_figure().savefig('kmeans00.png')
#     sfig = sns.scatterplot(data =df,x='x0',y='x1',hue='1'
sns.scatterplot(data =mu_df,x='x0',y='x1',hue='class',palette=cmap_mu,ax=sfig)
/opt/hostedtoolcache/Python/3.7.10/x64/lib/python3.7/site-packages/ipykernel_launcher.py:3: SettingWithCopyWarning:
A value is trying to be set on a copy of a slice from a DataFrame.
Try using .loc[row_indexer,col_indexer] = value instead

See the caveats in the documentation: https://pandas.pydata.org/pandas-docs/stable/user_guide/indexing.html#returning-a-view-versus-a-copy
  This is separate from the ipykernel package so we can avoid doing imports until
<AxesSubplot:xlabel='x0', ylabel='x1'>
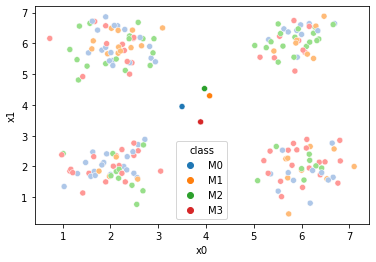
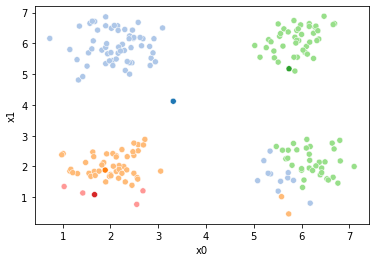
This puts the means all really close to the center, so we’ll try a different initialization for those: randomly sampling 4 points
mu = df[data_cols].sample(n=K).values
mu
array([[2.58, 2.71],
       [1.76, 1.85],
       [6.03, 5.78],
       [1.42, 1.14]])
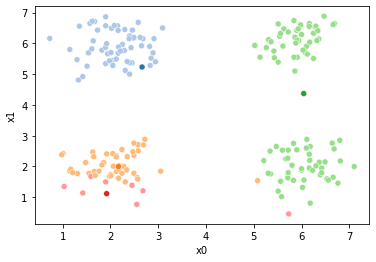
Now we can compute the distance from each point to each of the four means and use the closest one as an assignment. We’ll look at the assignments again.
i = 1
df[str(i)] = pd.concat([((df[data_cols]-mu_i)**2).sum(axis=1) for mu_i in mu],axis=1).idxmin(axis=1)


sfig = sns.scatterplot(data =df,x='x0',y='x1',hue='1',palette=cmap_pt,legend=False)
# plt.plot(mu[:,0],mu[:,1],marker='s',linewidth=0)
mu_df = mu_to_df(mu,i)
sns.scatterplot(data =mu_df,x='x0',y='x1',hue='class',palette=cmap_mu,ax=sfig,legend=False)
sfig.get_figure().savefig('kmeans01.png')
/opt/hostedtoolcache/Python/3.7.10/x64/lib/python3.7/site-packages/ipykernel_launcher.py:2: SettingWithCopyWarning:
A value is trying to be set on a copy of a slice from a DataFrame.
Try using .loc[row_indexer,col_indexer] = value instead

See the caveats in the documentation: https://pandas.pydata.org/pandas-docs/stable/user_guide/indexing.html#returning-a-view-versus-a-copy

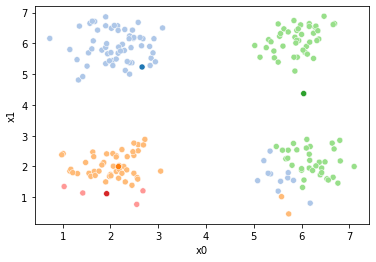
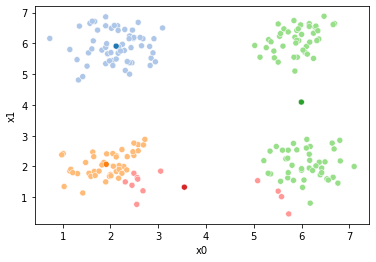
Now, we cna use those assignments, to compute new means:
mu = df.groupby('1')[data_cols].mean().values
# sfig = sns.scatterplot(data =df,x='x0',y='x1',hue='1')
# plt.plot(mu[:,0],mu[:,1],marker='s',linewidth=0)
fig = plt.figure()
mu_df = mu_to_df(mu,i)
sfig = sns.scatterplot(data =df,x='x0',y='x1',hue='1',palette=cmap_pt,legend=False)
sns.scatterplot(data =mu_df,x='x0',y='x1',hue='class',palette=cmap_mu,ax=sfig,legend=False)
sfig.get_figure().savefig('kmeans02.png')

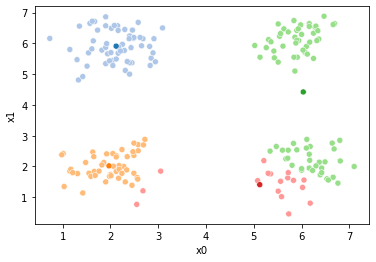
Now we can set up a while loop to continue the iterations
mu_list = [mu_to_df(mu,i)]
cur_old = str(i-1)
cur_new = str(i)
while sum(df[cur_old] !=df[cur_new]) >0:
cur_old = cur_new
i +=1
cur_new = str(i)
# update the assigments and plot with the associated means
df[cur_new] = pd.concat([((df[data_cols]-mu_i)**2).sum(axis=1) for mu_i in mu],axis=1).idxmin(axis=1)
fig = plt.figure()
sfig = sns.scatterplot(data =df,x='x0',y='x1',hue=cur_new,palette=cmap_pt,legend=False)
sns.scatterplot(data =mu_df,x='x0',y='x1',hue='class',palette=cmap_mu,ax=sfig,legend=False)
file_num = str(i*2 -1).zfill(2)
sfig.get_figure().savefig('kmeans' +file_num + '.png')
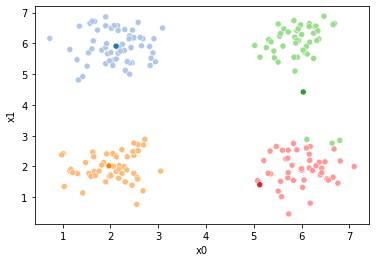
# update the means and plot with current generating assignments
mu = df.groupby(cur_new)[data_cols].mean().values
mu_df = mu_to_df(mu,i)
mu_list.append(mu_df)
fig = plt.figure()
sfig = sns.scatterplot(data =df,x='x0',y='x1',hue=cur_new,palette=cmap_pt,legend=False)
sns.scatterplot(data =mu_df,x='x0',y='x1',hue='class',palette=cmap_mu,ax=sfig,legend=False)
# plt.plot(mu[:,0],mu[:,1],marker='s',linewidth=0)
file_num = str(i*2).zfill(2)
sfig.get_figure().savefig('kmeans' +file_num + '.png')
n_iter = i
/opt/hostedtoolcache/Python/3.7.10/x64/lib/python3.7/site-packages/ipykernel_launcher.py:9: SettingWithCopyWarning:
A value is trying to be set on a copy of a slice from a DataFrame.
Try using .loc[row_indexer,col_indexer] = value instead

See the caveats in the documentation: https://pandas.pydata.org/pandas-docs/stable/user_guide/indexing.html#returning-a-view-versus-a-copy
  if __name__ == '__main__':


These plots can be saved and merged into a gif with, for example imagemagick to create the gifs above. Since we’ve saved them in a single dataframe, we can also look at that
df.head()
| x0 | x1 | 0 | 1 | 2 | 3 | 4 | 5 | 6 | 7 | 8 | 9 | |
|---|---|---|---|---|---|---|---|---|---|---|---|---|
| 0 | 6.80 | 2.85 | 3 | 2 | 2 | 2 | 2 | 2 | 2 | 2 | 3 | 3 |
| 1 | 5.90 | 6.42 | 0 | 2 | 2 | 2 | 2 | 2 | 2 | 2 | 2 | 2 |
| 2 | 6.37 | 2.14 | 3 | 2 | 2 | 2 | 2 | 2 | 2 | 3 | 3 | 3 |
| 3 | 2.17 | 1.62 | 2 | 1 | 1 | 1 | 1 | 1 | 1 | 1 | 1 | 1 |
| 4 | 1.90 | 6.86 | 0 | 0 | 0 | 0 | 0 | 0 | 0 | 0 | 0 | 0 |
We can also manipuate the dataframe to make plotting them all together easier.
df_vis = df.melt(id_vars = ['x0','x1'], var_name ='iteration',value_name='class')
df_vis.replace({'class':{i:c for i,c in enumerate(string.ascii_uppercase[:C])}},inplace=True)

df_vis['type'] = 'pt'
df_mu_vis = pd.concat([pd.concat(mu_list),df_vis])
cmap = sns.color_palette('tab20',8)
n_iter = i

sns.relplot(data=df_mu_vis,x='x0',y='x1',hue='class',col='iteration',
            col_wrap=3,hue_order = ['M0','A','M1','B','M2','C','M3','D'],
           palette = cmap,size='type',col_order=[str(i) for i in range(n_iter+1)])
<seaborn.axisgrid.FacetGrid at 0x7fbe28b4dfd0>
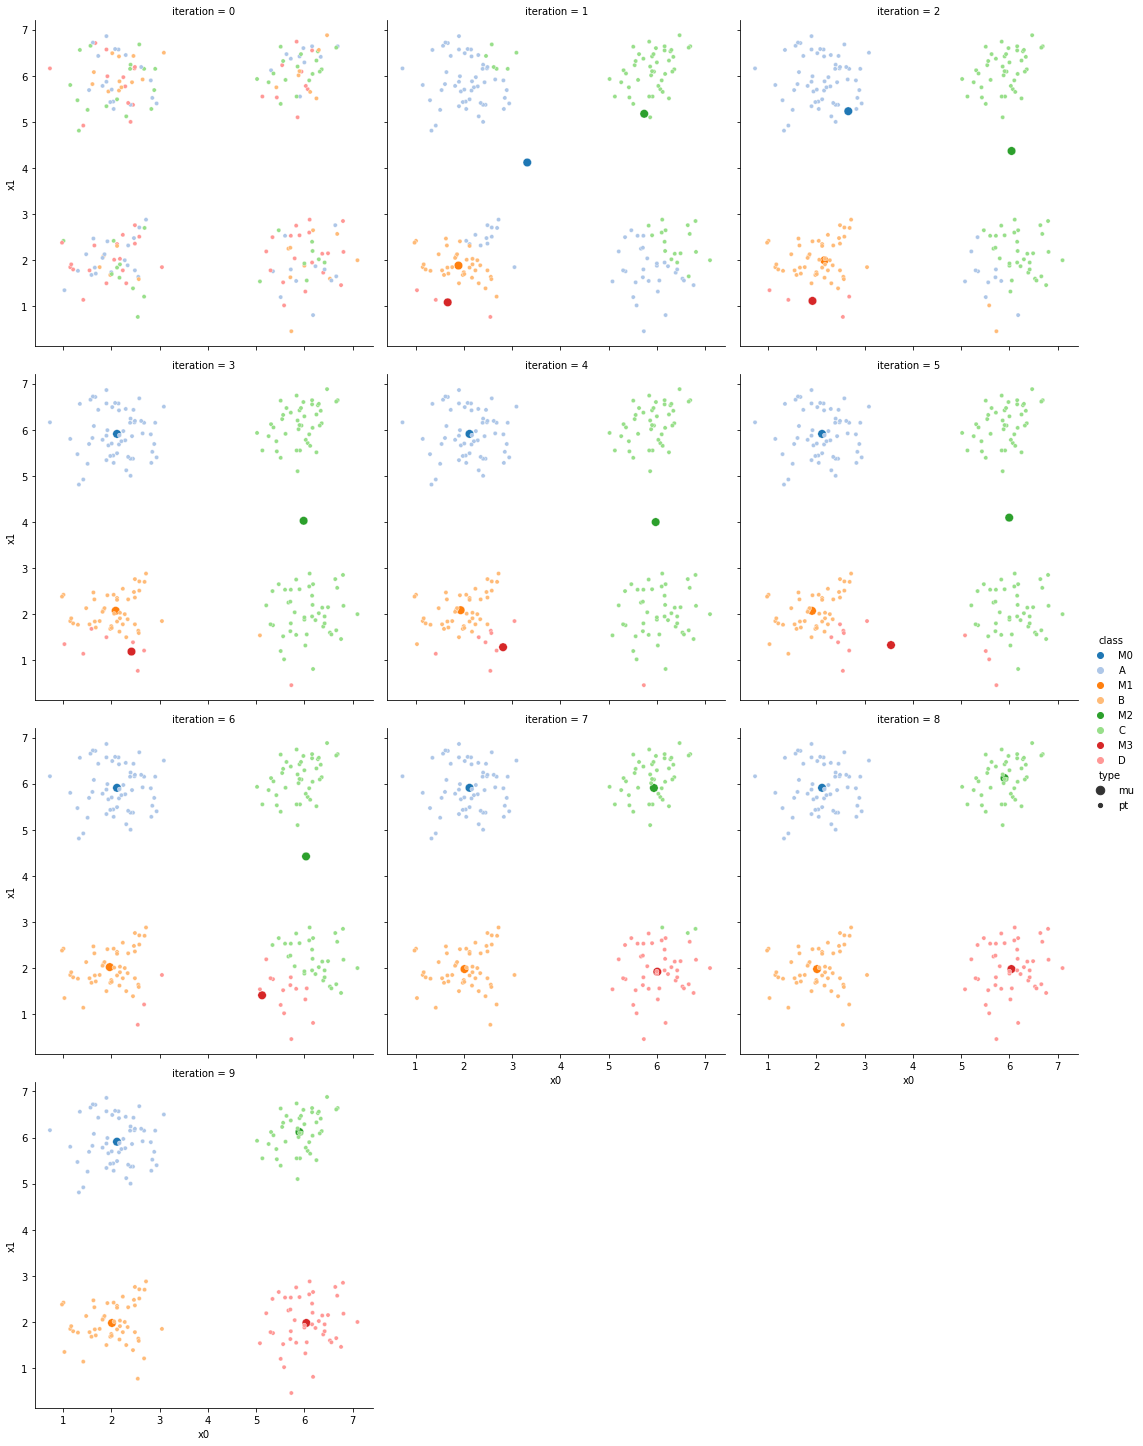
Here are a few different runs of the algorithm on the same dtaset.


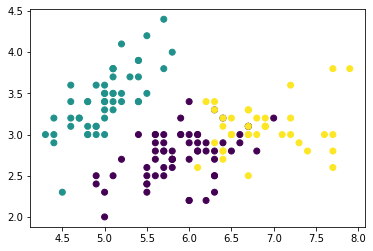
KMeans with Sklearn
iris_X, iris_y = datasets.load_iris(return_X_y=True)
km3 = KMeans(n_clusters=3)
iris_cluster3 = km3.fit_predict(iris_X)
plt.scatter(iris_X[:,0],iris_X[:,1],c=iris_cluster3)
<matplotlib.collections.PathCollection at 0x7fbe2e967190>
iris_cluster3 = km3.fit_predict(iris_X)
plt.scatter(iris_X[:,0],iris_X[:,1],c=iris_cluster3)
<matplotlib.collections.PathCollection at 0x7fbe2c2e6d10>
