Class 23: Interpretting Regression Evaluations
Snow in October. Share your thoughts in the zoom chat
Log onto prismia
# %load http://drsmb.co/310
import matplotlib.pyplot as plt
import seaborn as sns
import numpy as np
import pandas as pd
from sklearn import datasets, linear_model
from sklearn.metrics import mean_squared_error, r2_score
from sklearn.model_selection import cross_val_score
from sklearn.model_selection import train_test_split
X, y = datasets.load_boston(return_X_y= True)
X[:5]
array([[6.3200e-03, 1.8000e+01, 2.3100e+00, 0.0000e+00, 5.3800e-01,
        6.5750e+00, 6.5200e+01, 4.0900e+00, 1.0000e+00, 2.9600e+02,
        1.5300e+01, 3.9690e+02, 4.9800e+00],
       [2.7310e-02, 0.0000e+00, 7.0700e+00, 0.0000e+00, 4.6900e-01,
        6.4210e+00, 7.8900e+01, 4.9671e+00, 2.0000e+00, 2.4200e+02,
        1.7800e+01, 3.9690e+02, 9.1400e+00],
       [2.7290e-02, 0.0000e+00, 7.0700e+00, 0.0000e+00, 4.6900e-01,
        7.1850e+00, 6.1100e+01, 4.9671e+00, 2.0000e+00, 2.4200e+02,
        1.7800e+01, 3.9283e+02, 4.0300e+00],
       [3.2370e-02, 0.0000e+00, 2.1800e+00, 0.0000e+00, 4.5800e-01,
        6.9980e+00, 4.5800e+01, 6.0622e+00, 3.0000e+00, 2.2200e+02,
        1.8700e+01, 3.9463e+02, 2.9400e+00],
       [6.9050e-02, 0.0000e+00, 2.1800e+00, 0.0000e+00, 4.5800e-01,
        7.1470e+00, 5.4200e+01, 6.0622e+00, 3.0000e+00, 2.2200e+02,
        1.8700e+01, 3.9690e+02, 5.3300e+00]])
y[:5]
array([24. , 21.6, 34.7, 33.4, 36.2])
X_train, X_test, y_train, y_teest = train_test_split(X,y)
regr = linear_model.LinearRegression()
regr.fit(X_train, y_train)
LinearRegression()
regr.score(X_test,y_teest)
0.7076649858990918
y_pred = regr.predict(X_test)
# %load http://drsmb.co/310
col_name = ['ZN ',
'INDUS ',
'CHAS ',
'NOX ',
'RM ',
'AGE ',
'DIS ',
'RAD ',
'TAX ',
'PTRATIO ',
'B ',
'LSTAT ',
'MEDV ']
test_df = pd.DataFrame(data=X_test, columns = col_name)
test_df.head()
| ZN | INDUS | CHAS | NOX | RM | AGE | DIS | RAD | TAX | PTRATIO | B | LSTAT | MEDV | |
|---|---|---|---|---|---|---|---|---|---|---|---|---|---|
| 0 | 0.03871 | 52.5 | 5.32 | 0.0 | 0.405 | 6.209 | 31.3 | 7.3172 | 6.0 | 293.0 | 16.6 | 396.90 | 7.14 |
| 1 | 73.53410 | 0.0 | 18.10 | 0.0 | 0.679 | 5.957 | 100.0 | 1.8026 | 24.0 | 666.0 | 20.2 | 16.45 | 20.62 |
| 2 | 0.04301 | 80.0 | 1.91 | 0.0 | 0.413 | 5.663 | 21.9 | 10.5857 | 4.0 | 334.0 | 22.0 | 382.80 | 8.05 |
| 3 | 15.28800 | 0.0 | 18.10 | 0.0 | 0.671 | 6.649 | 93.3 | 1.3449 | 24.0 | 666.0 | 20.2 | 363.02 | 23.24 |
| 4 | 5.87205 | 0.0 | 18.10 | 0.0 | 0.693 | 6.405 | 96.0 | 1.6768 | 24.0 | 666.0 | 20.2 | 396.90 | 19.37 |
test_df['y_test'] = y_teest
test_df['y_pred'] = y_pred
error = lambda r: r['y_test'] - r['y_pred']
test_df['pred_error'] = test_df.apply(error,axis=1)
test_df['errror'] = y_teest - y_pred
test_df.head()
| ZN | INDUS | CHAS | NOX | RM | AGE | DIS | RAD | TAX | PTRATIO | B | LSTAT | MEDV | y_test | y_pred | pred_error | errror | |
|---|---|---|---|---|---|---|---|---|---|---|---|---|---|---|---|---|---|
| 0 | 0.03871 | 52.5 | 5.32 | 0.0 | 0.405 | 6.209 | 31.3 | 7.3172 | 6.0 | 293.0 | 16.6 | 396.90 | 7.14 | 23.2 | 27.424469 | -4.224469 | -4.224469 |
| 1 | 73.53410 | 0.0 | 18.10 | 0.0 | 0.679 | 5.957 | 100.0 | 1.8026 | 24.0 | 666.0 | 20.2 | 16.45 | 20.62 | 8.8 | 3.819213 | 4.980787 | 4.980787 |
| 2 | 0.04301 | 80.0 | 1.91 | 0.0 | 0.413 | 5.663 | 21.9 | 10.5857 | 4.0 | 334.0 | 22.0 | 382.80 | 8.05 | 18.2 | 15.002808 | 3.197192 | 3.197192 |
| 3 | 15.28800 | 0.0 | 18.10 | 0.0 | 0.671 | 6.649 | 93.3 | 1.3449 | 24.0 | 666.0 | 20.2 | 363.02 | 23.24 | 13.9 | 17.059901 | -3.159901 | -3.159901 |
| 4 | 5.87205 | 0.0 | 18.10 | 0.0 | 0.693 | 6.405 | 96.0 | 1.6768 | 24.0 | 666.0 | 20.2 | 396.90 | 19.37 | 12.5 | 19.050195 | -6.550195 | -6.550195 |
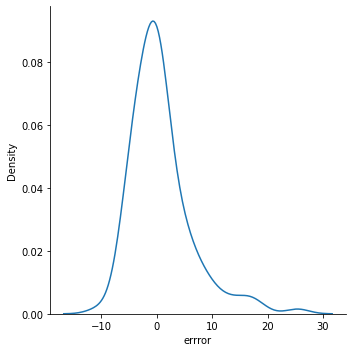
sns.displot(data=test_df, x='errror', kind = 'kde')
<seaborn.axisgrid.FacetGrid at 0x7f13cafe5090>