Exploratory Data Analysis
Contents
8. Exploratory Data Analysis#
import pandas as pd
import seaborn as sns
sns.set_theme(palette= "colorblind")
arabica_data_url = 'https://raw.githubusercontent.com/jldbc/coffee-quality-database/master/data/arabica_data_cleaned.csv'

coffee_df = pd.read_csv(arabica_data_url)
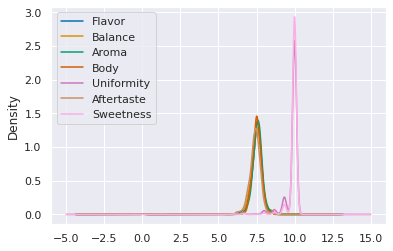
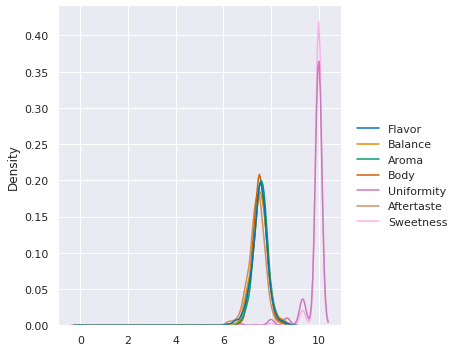
Which of the following scores is distributed most similarly to Sweetness?
scores_of_interest = ['Flavor','Balance','Aroma','Body',
                      'Uniformity','Aftertaste','Sweetness']
First step is to subset the data:
coffee_df[scores_of_interest].head(2)
| Flavor | Balance | Aroma | Body | Uniformity | Aftertaste | Sweetness | |
|---|---|---|---|---|---|---|---|
| 0 | 8.83 | 8.42 | 8.67 | 8.50 | 10.0 | 8.67 | 10.0 |
| 1 | 8.67 | 8.42 | 8.75 | 8.42 | 10.0 | 8.50 | 10.0 |
Then we produce a kde plot
coffee_df[scores_of_interest].plot(kind='kde')
<AxesSubplot:ylabel='Density'>
We could also do it with seaborn
sns.displot(data=coffee_df[scores_of_interest],kind='kde')
<seaborn.axisgrid.FacetGrid at 0x7f8806ddbf10>
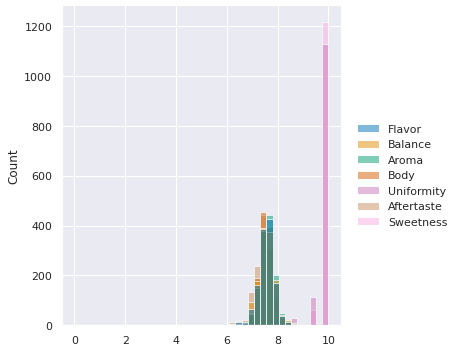
If we forget the parameter kind, we get its default value,
which is histogram
print('\n'.join(sns.displot.__doc__.split('\n')[5:10]))
``kind`` parameter selects the approach to use:

- :func:`histplot` (with ``kind="hist"``; the default)
- :func:`kdeplot` (with ``kind="kde"``)
- :func:`ecdfplot` (with ``kind="ecdf"``; univariate-only)
sns.displot(data=coffee_df[scores_of_interest])
<seaborn.axisgrid.FacetGrid at 0x7f8802869580>
8.1. Summarizing with two variables#
So, we can summarize data now, but the summaries we have done so far have treated each variable one at a time. The most interesting patterns are in often in how multiple variables interact. We’ll do some modeling that looks at multivariate functions of data in a few weeks, but for now, we do a little more with summary statistics.
On Monday, we saw how to see how many reviews there were per country, using value_counts() on the Country.of.Origin column.
coffee_df['Country.of.Origin'].value_counts().head(2)
Mexico      236
Colombia    183
Name: Country.of.Origin, dtype: int64
The data also has Number.of.Bags however. How can we check which has the most bags?
We can do this with groupby.
coffee_df.groupby('Country.of.Origin')['Number.of.Bags'].sum()
Country.of.Origin
Brazil                          30534
Burundi                           520
China                              55
Colombia                        41204
Costa Rica                      10354
Cote d?Ivoire                       2
Ecuador                             1
El Salvador                      4449
Ethiopia                        11761
Guatemala                       36868
Haiti                             390
Honduras                        13167
India                              20
Indonesia                        1658
Japan                              20
Kenya                            3971
Laos                               81
Malawi                            557
Mauritius                           1
Mexico                          24140
Myanmar                            10
Nicaragua                        6406
Panama                            537
Papua New Guinea                    7
Peru                             2336
Philippines                       259
Rwanda                            150
Taiwan                           1914
Tanzania, United Republic Of     3760
Thailand                         1310
Uganda                           3868
United States                     361
United States (Hawaii)            833
United States (Puerto Rico)        71
Vietnam                            10
Zambia                             13
Name: Number.of.Bags, dtype: int64
What just happened?
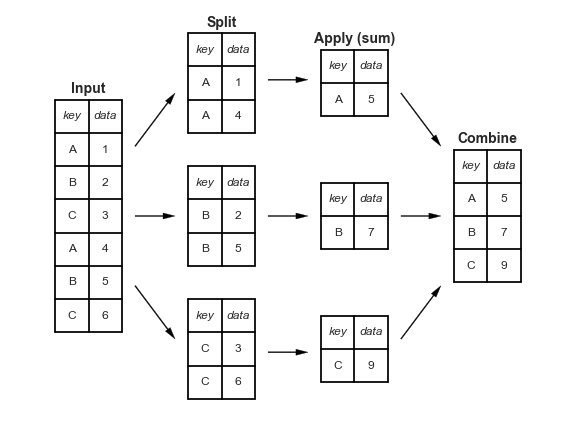
Groupby splits the whole dataframe into parts where each part has the same value for Country.of.Origin and then after that, we extracted the Number.of.Bags column, took the sum (within each separate group) and then put it all back together in one table (in this case, a Series becuase we picked one variable out)
8.2. How doe Groupby Work?#
We can view this by saving the groupby object as a variable and exploring it.
country_grouped = coffee_df.groupby('Country.of.Origin')

country_grouped
<pandas.core.groupby.generic.DataFrameGroupBy object at 0x7f880280ab20>
Trying to look at it without applying additional functions, just tells us the type. But, it’s iterable, so we can loop over.
for country,df in country_grouped:
    print(type(country), type(df))
<class 'str'> <class 'pandas.core.frame.DataFrame'>
<class 'str'> <class 'pandas.core.frame.DataFrame'>
<class 'str'> <class 'pandas.core.frame.DataFrame'>
<class 'str'> <class 'pandas.core.frame.DataFrame'>
<class 'str'> <class 'pandas.core.frame.DataFrame'>
<class 'str'> <class 'pandas.core.frame.DataFrame'>
<class 'str'> <class 'pandas.core.frame.DataFrame'>
<class 'str'> <class 'pandas.core.frame.DataFrame'>
<class 'str'> <class 'pandas.core.frame.DataFrame'>
<class 'str'> <class 'pandas.core.frame.DataFrame'>
<class 'str'> <class 'pandas.core.frame.DataFrame'>
<class 'str'> <class 'pandas.core.frame.DataFrame'>
<class 'str'> <class 'pandas.core.frame.DataFrame'>
<class 'str'> <class 'pandas.core.frame.DataFrame'>
<class 'str'> <class 'pandas.core.frame.DataFrame'>
<class 'str'> <class 'pandas.core.frame.DataFrame'>
<class 'str'> <class 'pandas.core.frame.DataFrame'>
<class 'str'> <class 'pandas.core.frame.DataFrame'>
<class 'str'> <class 'pandas.core.frame.DataFrame'>
<class 'str'> <class 'pandas.core.frame.DataFrame'>
<class 'str'> <class 'pandas.core.frame.DataFrame'>
<class 'str'> <class 'pandas.core.frame.DataFrame'>
<class 'str'> <class 'pandas.core.frame.DataFrame'>
<class 'str'> <class 'pandas.core.frame.DataFrame'>
<class 'str'> <class 'pandas.core.frame.DataFrame'>
<class 'str'> <class 'pandas.core.frame.DataFrame'>
<class 'str'> <class 'pandas.core.frame.DataFrame'>
<class 'str'> <class 'pandas.core.frame.DataFrame'>
<class 'str'> <class 'pandas.core.frame.DataFrame'>
<class 'str'> <class 'pandas.core.frame.DataFrame'>
<class 'str'> <class 'pandas.core.frame.DataFrame'>
<class 'str'> <class 'pandas.core.frame.DataFrame'>
<class 'str'> <class 'pandas.core.frame.DataFrame'>
<class 'str'> <class 'pandas.core.frame.DataFrame'>
<class 'str'> <class 'pandas.core.frame.DataFrame'>
<class 'str'> <class 'pandas.core.frame.DataFrame'>
We could manually compute things using the data structure, if needed, though using pandas functionality will usually do what we want. For example:
bag_total_dict = {}

for country,df in country_grouped:
    tot_bags =  df['Number.of.Bags'].sum()
    bag_total_dict[country] = tot_bags

pd.DataFrame.from_dict(bag_total_dict, orient='index',
                           columns = ['Number.of.Bags.Sum'])
| Number.of.Bags.Sum | |
|---|---|
| Brazil | 30534 |
| Burundi | 520 |
| China | 55 |
| Colombia | 41204 |
| Costa Rica | 10354 |
| Cote d?Ivoire | 2 |
| Ecuador | 1 |
| El Salvador | 4449 |
| Ethiopia | 11761 |
| Guatemala | 36868 |
| Haiti | 390 |
| Honduras | 13167 |
| India | 20 |
| Indonesia | 1658 |
| Japan | 20 |
| Kenya | 3971 |
| Laos | 81 |
| Malawi | 557 |
| Mauritius | 1 |
| Mexico | 24140 |
| Myanmar | 10 |
| Nicaragua | 6406 |
| Panama | 537 |
| Papua New Guinea | 7 |
| Peru | 2336 |
| Philippines | 259 |
| Rwanda | 150 |
| Taiwan | 1914 |
| Tanzania, United Republic Of | 3760 |
| Thailand | 1310 |
| Uganda | 3868 |
| United States | 361 |
| United States (Hawaii) | 833 |
| United States (Puerto Rico) | 71 |
| Vietnam | 10 |
| Zambia | 13 |
is the same as what we did before
Question from class
How can we sort it?
First, we’ll make it a variable to keep the code legible, then we’ll use sort_values()
bag_total_df = coffee_df.groupby('Country.of.Origin')['Number.of.Bags'].sum()
bag_total_df.sort_values()
Country.of.Origin
Mauritius                           1
Ecuador                             1
Cote d?Ivoire                       2
Papua New Guinea                    7
Vietnam                            10
Myanmar                            10
Zambia                             13
India                              20
Japan                              20
China                              55
United States (Puerto Rico)        71
Laos                               81
Rwanda                            150
Philippines                       259
United States                     361
Haiti                             390
Burundi                           520
Panama                            537
Malawi                            557
United States (Hawaii)            833
Thailand                         1310
Indonesia                        1658
Taiwan                           1914
Peru                             2336
Tanzania, United Republic Of     3760
Uganda                           3868
Kenya                            3971
El Salvador                      4449
Nicaragua                        6406
Costa Rica                      10354
Ethiopia                        11761
Honduras                        13167
Mexico                          24140
Brazil                          30534
Guatemala                       36868
Colombia                        41204
Name: Number.of.Bags, dtype: int64
Which, by default uses ascending order, the method has an ascending parameter and its default value is True, so we can switch it to False to get descending
bag_total_df.sort_values(ascending=False,)
Country.of.Origin
Colombia                        41204
Guatemala                       36868
Brazil                          30534
Mexico                          24140
Honduras                        13167
Ethiopia                        11761
Costa Rica                      10354
Nicaragua                        6406
El Salvador                      4449
Kenya                            3971
Uganda                           3868
Tanzania, United Republic Of     3760
Peru                             2336
Taiwan                           1914
Indonesia                        1658
Thailand                         1310
United States (Hawaii)            833
Malawi                            557
Panama                            537
Burundi                           520
Haiti                             390
United States                     361
Philippines                       259
Rwanda                            150
Laos                               81
United States (Puerto Rico)        71
China                              55
India                              20
Japan                              20
Zambia                             13
Myanmar                            10
Vietnam                            10
Papua New Guinea                    7
Cote d?Ivoire                       2
Ecuador                             1
Mauritius                           1
Name: Number.of.Bags, dtype: int64
8.3. Customizing Data Summaries#
We’ve looked at an overall summary with describe on all the variables, describe on one variable, individual statistics on all variables, and individual statistics on one variable. We can also build summaries of multiple varialbes with a custom subset of summary statistics, with aggregate or using its alias agg
country_grouped.agg({'Number.of.Bags':'sum',
                     'Balance':['mean','count'],})
| Number.of.Bags | Balance | ||
|---|---|---|---|
| sum | mean | count | |
| Country.of.Origin | |||
| Brazil | 30534 | 7.531515 | 132 |
| Burundi | 520 | 7.415000 | 2 |
| China | 55 | 7.548125 | 16 |
| Colombia | 41204 | 7.708415 | 183 |
| Costa Rica | 10354 | 7.637255 | 51 |
| Cote d?Ivoire | 2 | 7.080000 | 1 |
| Ecuador | 1 | 7.830000 | 1 |
| El Salvador | 4449 | 7.711429 | 21 |
| Ethiopia | 11761 | 7.972273 | 44 |
| Guatemala | 36868 | 7.469890 | 181 |
| Haiti | 390 | 7.056667 | 6 |
| Honduras | 13167 | 7.163962 | 53 |
| India | 20 | 7.420000 | 1 |
| Indonesia | 1658 | 7.520000 | 20 |
| Japan | 20 | 7.830000 | 1 |
| Kenya | 3971 | 7.800400 | 25 |
| Laos | 81 | 7.416667 | 3 |
| Malawi | 557 | 7.371818 | 11 |
| Mauritius | 1 | 7.170000 | 1 |
| Mexico | 24140 | 7.328686 | 236 |
| Myanmar | 10 | 7.133750 | 8 |
| Nicaragua | 6406 | 7.278462 | 26 |
| Panama | 537 | 7.875000 | 4 |
| Papua New Guinea | 7 | 8.250000 | 1 |
| Peru | 2336 | 7.666000 | 10 |
| Philippines | 259 | 7.400000 | 5 |
| Rwanda | 150 | 7.750000 | 1 |
| Taiwan | 1914 | 7.426000 | 75 |
| Tanzania, United Republic Of | 3760 | 7.469750 | 40 |
| Thailand | 1310 | 7.524063 | 32 |
| Uganda | 3868 | 7.660769 | 26 |
| United States | 361 | 7.947500 | 8 |
| United States (Hawaii) | 833 | 7.644110 | 73 |
| United States (Puerto Rico) | 71 | 7.647500 | 4 |
| Vietnam | 10 | 7.547143 | 7 |
| Zambia | 13 | 7.420000 | 1 |
We could also string this together, but splitting into interim variables makes code more readable. Shorter lines are easier to read (and sometimes auto-enforced on projects). Also, by giving a good variable name to the interim states we get more description, which can help a human better read it.
coffee_df.groupby('Country.of.Origin').agg({'Number.of.Bags':'sum','Balance':['mean','count'],})
| Number.of.Bags | Balance | ||
|---|---|---|---|
| sum | mean | count | |
| Country.of.Origin | |||
| Brazil | 30534 | 7.531515 | 132 |
| Burundi | 520 | 7.415000 | 2 |
| China | 55 | 7.548125 | 16 |
| Colombia | 41204 | 7.708415 | 183 |
| Costa Rica | 10354 | 7.637255 | 51 |
| Cote d?Ivoire | 2 | 7.080000 | 1 |
| Ecuador | 1 | 7.830000 | 1 |
| El Salvador | 4449 | 7.711429 | 21 |
| Ethiopia | 11761 | 7.972273 | 44 |
| Guatemala | 36868 | 7.469890 | 181 |
| Haiti | 390 | 7.056667 | 6 |
| Honduras | 13167 | 7.163962 | 53 |
| India | 20 | 7.420000 | 1 |
| Indonesia | 1658 | 7.520000 | 20 |
| Japan | 20 | 7.830000 | 1 |
| Kenya | 3971 | 7.800400 | 25 |
| Laos | 81 | 7.416667 | 3 |
| Malawi | 557 | 7.371818 | 11 |
| Mauritius | 1 | 7.170000 | 1 |
| Mexico | 24140 | 7.328686 | 236 |
| Myanmar | 10 | 7.133750 | 8 |
| Nicaragua | 6406 | 7.278462 | 26 |
| Panama | 537 | 7.875000 | 4 |
| Papua New Guinea | 7 | 8.250000 | 1 |
| Peru | 2336 | 7.666000 | 10 |
| Philippines | 259 | 7.400000 | 5 |
| Rwanda | 150 | 7.750000 | 1 |
| Taiwan | 1914 | 7.426000 | 75 |
| Tanzania, United Republic Of | 3760 | 7.469750 | 40 |
| Thailand | 1310 | 7.524063 | 32 |
| Uganda | 3868 | 7.660769 | 26 |
| United States | 361 | 7.947500 | 8 |
| United States (Hawaii) | 833 | 7.644110 | 73 |
| United States (Puerto Rico) | 71 | 7.647500 | 4 |
| Vietnam | 10 | 7.547143 | 7 |
| Zambia | 13 | 7.420000 | 1 |
Question from Class
What does the count do? or how can we figure it out?
In this case, let’s compare count to shape we know that shape returns the number of rows and columns. Also shape is an attribute, not a method (so no () for shape). However, there’s a more important difference.
coffee_df['Balance','Farm.Name','Lot.Number'].shape
---------------------------------------------------------------------------
KeyError                                  Traceback (most recent call last)
File /opt/hostedtoolcache/Python/3.8.13/x64/lib/python3.8/site-packages/pandas/core/indexes/base.py:3621, in Index.get_loc(self, key, method, tolerance)
   3620 try:
-> 3621     return self._engine.get_loc(casted_key)
   3622 except KeyError as err:

File /opt/hostedtoolcache/Python/3.8.13/x64/lib/python3.8/site-packages/pandas/_libs/index.pyx:136, in pandas._libs.index.IndexEngine.get_loc()

File /opt/hostedtoolcache/Python/3.8.13/x64/lib/python3.8/site-packages/pandas/_libs/index.pyx:163, in pandas._libs.index.IndexEngine.get_loc()

File pandas/_libs/hashtable_class_helper.pxi:5198, in pandas._libs.hashtable.PyObjectHashTable.get_item()

File pandas/_libs/hashtable_class_helper.pxi:5206, in pandas._libs.hashtable.PyObjectHashTable.get_item()

KeyError: ('Balance', 'Farm.Name', 'Lot.Number')

The above exception was the direct cause of the following exception:

KeyError                                  Traceback (most recent call last)
Input In [18], in <cell line: 1>()
----> 1 coffee_df['Balance','Farm.Name','Lot.Number'].shape

File /opt/hostedtoolcache/Python/3.8.13/x64/lib/python3.8/site-packages/pandas/core/frame.py:3505, in DataFrame.__getitem__(self, key)
   3503 if self.columns.nlevels > 1:
   3504     return self._getitem_multilevel(key)
-> 3505 indexer = self.columns.get_loc(key)
   3506 if is_integer(indexer):
   3507     indexer = [indexer]

File /opt/hostedtoolcache/Python/3.8.13/x64/lib/python3.8/site-packages/pandas/core/indexes/base.py:3623, in Index.get_loc(self, key, method, tolerance)
   3621     return self._engine.get_loc(casted_key)
   3622 except KeyError as err:
-> 3623     raise KeyError(key) from err
   3624 except TypeError:
   3625     # If we have a listlike key, _check_indexing_error will raise
   3626     #  InvalidIndexError. Otherwise we fall through and re-raise
   3627     #  the TypeError.
   3628     self._check_indexing_error(key)

KeyError: ('Balance', 'Farm.Name', 'Lot.Number')
coffee_df['Balance','Farm.Name','Lot.Number'].count()
---------------------------------------------------------------------------
KeyError                                  Traceback (most recent call last)
File /opt/hostedtoolcache/Python/3.8.13/x64/lib/python3.8/site-packages/pandas/core/indexes/base.py:3621, in Index.get_loc(self, key, method, tolerance)
   3620 try:
-> 3621     return self._engine.get_loc(casted_key)
   3622 except KeyError as err:

File /opt/hostedtoolcache/Python/3.8.13/x64/lib/python3.8/site-packages/pandas/_libs/index.pyx:136, in pandas._libs.index.IndexEngine.get_loc()

File /opt/hostedtoolcache/Python/3.8.13/x64/lib/python3.8/site-packages/pandas/_libs/index.pyx:163, in pandas._libs.index.IndexEngine.get_loc()

File pandas/_libs/hashtable_class_helper.pxi:5198, in pandas._libs.hashtable.PyObjectHashTable.get_item()

File pandas/_libs/hashtable_class_helper.pxi:5206, in pandas._libs.hashtable.PyObjectHashTable.get_item()

KeyError: ('Balance', 'Farm.Name', 'Lot.Number')

The above exception was the direct cause of the following exception:

KeyError                                  Traceback (most recent call last)
Input In [19], in <cell line: 1>()
----> 1 coffee_df['Balance','Farm.Name','Lot.Number'].count()

File /opt/hostedtoolcache/Python/3.8.13/x64/lib/python3.8/site-packages/pandas/core/frame.py:3505, in DataFrame.__getitem__(self, key)
   3503 if self.columns.nlevels > 1:
   3504     return self._getitem_multilevel(key)
-> 3505 indexer = self.columns.get_loc(key)
   3506 if is_integer(indexer):
   3507     indexer = [indexer]

File /opt/hostedtoolcache/Python/3.8.13/x64/lib/python3.8/site-packages/pandas/core/indexes/base.py:3623, in Index.get_loc(self, key, method, tolerance)
   3621     return self._engine.get_loc(casted_key)
   3622 except KeyError as err:
-> 3623     raise KeyError(key) from err
   3624 except TypeError:
   3625     # If we have a listlike key, _check_indexing_error will raise
   3626     #  InvalidIndexError. Otherwise we fall through and re-raise
   3627     #  the TypeError.
   3628     self._check_indexing_error(key)

KeyError: ('Balance', 'Farm.Name', 'Lot.Number')
Here we get different number for Balance and Farm Name
The shape tells us how many rows there are, while count tells us how many are not null.
We can verify visually that some are null with:
coffee_df.head()
| Unnamed: 0 | Species | Owner | Country.of.Origin | Farm.Name | Lot.Number | Mill | ICO.Number | Company | Altitude | ... | Color | Category.Two.Defects | Expiration | Certification.Body | Certification.Address | Certification.Contact | unit_of_measurement | altitude_low_meters | altitude_high_meters | altitude_mean_meters | |
|---|---|---|---|---|---|---|---|---|---|---|---|---|---|---|---|---|---|---|---|---|---|
| 0 | 1 | Arabica | metad plc | Ethiopia | metad plc | NaN | metad plc | 2014/2015 | metad agricultural developmet plc | 1950-2200 | ... | Green | 0 | April 3rd, 2016 | METAD Agricultural Development plc | 309fcf77415a3661ae83e027f7e5f05dad786e44 | 19fef5a731de2db57d16da10287413f5f99bc2dd | m | 1950.0 | 2200.0 | 2075.0 |
| 1 | 2 | Arabica | metad plc | Ethiopia | metad plc | NaN | metad plc | 2014/2015 | metad agricultural developmet plc | 1950-2200 | ... | Green | 1 | April 3rd, 2016 | METAD Agricultural Development plc | 309fcf77415a3661ae83e027f7e5f05dad786e44 | 19fef5a731de2db57d16da10287413f5f99bc2dd | m | 1950.0 | 2200.0 | 2075.0 |
| 2 | 3 | Arabica | grounds for health admin | Guatemala | san marcos barrancas "san cristobal cuch | NaN | NaN | NaN | NaN | 1600 - 1800 m | ... | NaN | 0 | May 31st, 2011 | Specialty Coffee Association | 36d0d00a3724338ba7937c52a378d085f2172daa | 0878a7d4b9d35ddbf0fe2ce69a2062cceb45a660 | m | 1600.0 | 1800.0 | 1700.0 |
| 3 | 4 | Arabica | yidnekachew dabessa | Ethiopia | yidnekachew dabessa coffee plantation | NaN | wolensu | NaN | yidnekachew debessa coffee plantation | 1800-2200 | ... | Green | 2 | March 25th, 2016 | METAD Agricultural Development plc | 309fcf77415a3661ae83e027f7e5f05dad786e44 | 19fef5a731de2db57d16da10287413f5f99bc2dd | m | 1800.0 | 2200.0 | 2000.0 |
| 4 | 5 | Arabica | metad plc | Ethiopia | metad plc | NaN | metad plc | 2014/2015 | metad agricultural developmet plc | 1950-2200 | ... | Green | 2 | April 3rd, 2016 | METAD Agricultural Development plc | 309fcf77415a3661ae83e027f7e5f05dad786e44 | 19fef5a731de2db57d16da10287413f5f99bc2dd | m | 1950.0 | 2200.0 | 2075.0 |
5 rows × 44 columns
Correction
This response is slightly corrected from what I said in class, because in the balance column, it does match, but in general it doesn’t. count on grouped will only be the same as value_count when count is applied to a column that does not have any missing values where the grouping variable has a value.
On the balance column alone in class, we checked that the grouped count matched the country value counts.
country_grouped[['Balance','Farm.Name','Lot.Number']].count().sort_values(by='Balance'
    ascending=False)
  Input In [21]
    ascending=False)
    ^
SyntaxError: invalid syntax
coffee_df['Country.of.Origin'].value_counts()
Mexico                          236
Colombia                        183
Guatemala                       181
Brazil                          132
Taiwan                           75
United States (Hawaii)           73
Honduras                         53
Costa Rica                       51
Ethiopia                         44
Tanzania, United Republic Of     40
Thailand                         32
Uganda                           26
Nicaragua                        26
Kenya                            25
El Salvador                      21
Indonesia                        20
China                            16
Malawi                           11
Peru                             10
United States                     8
Myanmar                           8
Vietnam                           7
Haiti                             6
Philippines                       5
Panama                            4
United States (Puerto Rico)       4
Laos                              3
Burundi                           2
Ecuador                           1
Rwanda                            1
Japan                             1
Zambia                            1
Papua New Guinea                  1
Mauritius                         1
Cote d?Ivoire                     1
India                             1
Name: Country.of.Origin, dtype: int64
In class, they were the same, because Balance doesn’t have missing values. Farm.Name and Lot.Number havea lot of missing values, so they’re different numbers.
Another function we could use when we first examine a dataset is info this tells us about the NaN values up front.
coffee_df.info()
<class 'pandas.core.frame.DataFrame'>
RangeIndex: 1311 entries, 0 to 1310
Data columns (total 44 columns):
 #   Column                 Non-Null Count  Dtype
---  ------                 --------------  -----
 0   Unnamed: 0             1311 non-null   int64
 1   Species                1311 non-null   object
 2   Owner                  1304 non-null   object
 3   Country.of.Origin      1310 non-null   object
 4   Farm.Name              955 non-null    object
 5   Lot.Number             270 non-null    object
 6   Mill                   1001 non-null   object
 7   ICO.Number             1165 non-null   object
 8   Company                1102 non-null   object
 9   Altitude               1088 non-null   object
 10  Region                 1254 non-null   object
 11  Producer               1081 non-null   object
 12  Number.of.Bags         1311 non-null   int64
 13  Bag.Weight             1311 non-null   object
 14  In.Country.Partner     1311 non-null   object
 15  Harvest.Year           1264 non-null   object
 16  Grading.Date           1311 non-null   object
 17  Owner.1                1304 non-null   object
 18  Variety                1110 non-null   object
 19  Processing.Method      1159 non-null   object
 20  Aroma                  1311 non-null   float64
 21  Flavor                 1311 non-null   float64
 22  Aftertaste             1311 non-null   float64
 23  Acidity                1311 non-null   float64
 24  Body                   1311 non-null   float64
 25  Balance                1311 non-null   float64
 26  Uniformity             1311 non-null   float64
 27  Clean.Cup              1311 non-null   float64
 28  Sweetness              1311 non-null   float64
 29  Cupper.Points          1311 non-null   float64
 30  Total.Cup.Points       1311 non-null   float64
 31  Moisture               1311 non-null   float64
 32  Category.One.Defects   1311 non-null   int64
 33  Quakers                1310 non-null   float64
 34  Color                  1095 non-null   object
 35  Category.Two.Defects   1311 non-null   int64
 36  Expiration             1311 non-null   object
 37  Certification.Body     1311 non-null   object
 38  Certification.Address  1311 non-null   object
 39  Certification.Contact  1311 non-null   object
 40  unit_of_measurement    1311 non-null   object
 41  altitude_low_meters    1084 non-null   float64
 42  altitude_high_meters   1084 non-null   float64
 43  altitude_mean_meters   1084 non-null   float64
dtypes: float64(16), int64(4), object(24)
memory usage: 450.8+ KB
8.4. Using summaries for visualization#
Important
This section is an extension, that we didn’t get to in class, but might help in your assignment
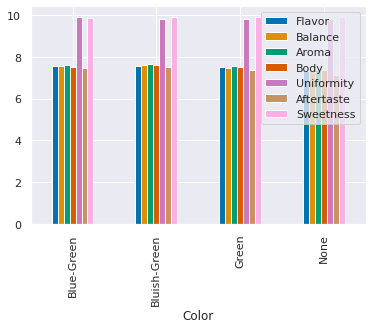
For example, we can group by color and take the mean of each of the scores from the beginning of class and then use a bar chart.
color_grouped = coffee_df.groupby('Color')[scores_of_interest].mean()
color_grouped.plot(kind='bar')
<AxesSubplot:xlabel='Color'>
8.5. Questions after class#
Ram Token Opportunity
add a question with a pull request; earn 1-2 ram tokens for submitting a question with the answer (with sources)
8.6. More Practice#
Make a table thats total number of bags and mean and count of scored for each of the variables in the
scores_of_interestlist.Make a bar chart of the mean score for each variable
scores_of_interestgrouped by country.

