Welcome to Programming to Data Science
Contents
1. Welcome to Programming to Data Science#
1.1. Prismia Chat#
We will use these to monitor your participation in class and to gather information. Features:
instructor only
reply to you directly
share responses for all
1.2. How this class will work#
Participatory Live Coding
What is a topic you want to use data to learn about?
1.3. Programming for Data Science vs other Programming#
The audience is different, so the form is different.
In Data Science our product is more often a report than a program.
Note
Also, in data science we are using code to interact with data, instead of having a plan in advance
So programming for data science is more like writing it has a narrative flow and is made to be seen more than some other programming thaat you may have done.
1.4. Get Organized!#
In this class you will have many separate folders that your work is in. The separate folders are required because we will use GitHub for submission.
I recommend you make a folder for this class and make all of your other folders inside that.
Create a separate notes folder in there too. We will be writing code each class, that you should keep your own notes.
Important
If you made your notebook in a location other than where you want it to be, you can move it like any other file using Finder on mac or File Explorer on Windows.
1.5. Jupyter Notebooks#
Launch a jupyter notebook server:
on Windows, use anaconda terminal
on Mac/Linux, use terminal
cd path/to/where/you/save/notes
jupyter notebook
1.5.1. What just happened?#
launched a local web server
opened a new browser tab pointed to it

1.5.2. Start a Notebook#
Go to the new menu in the top right and choose Python 3
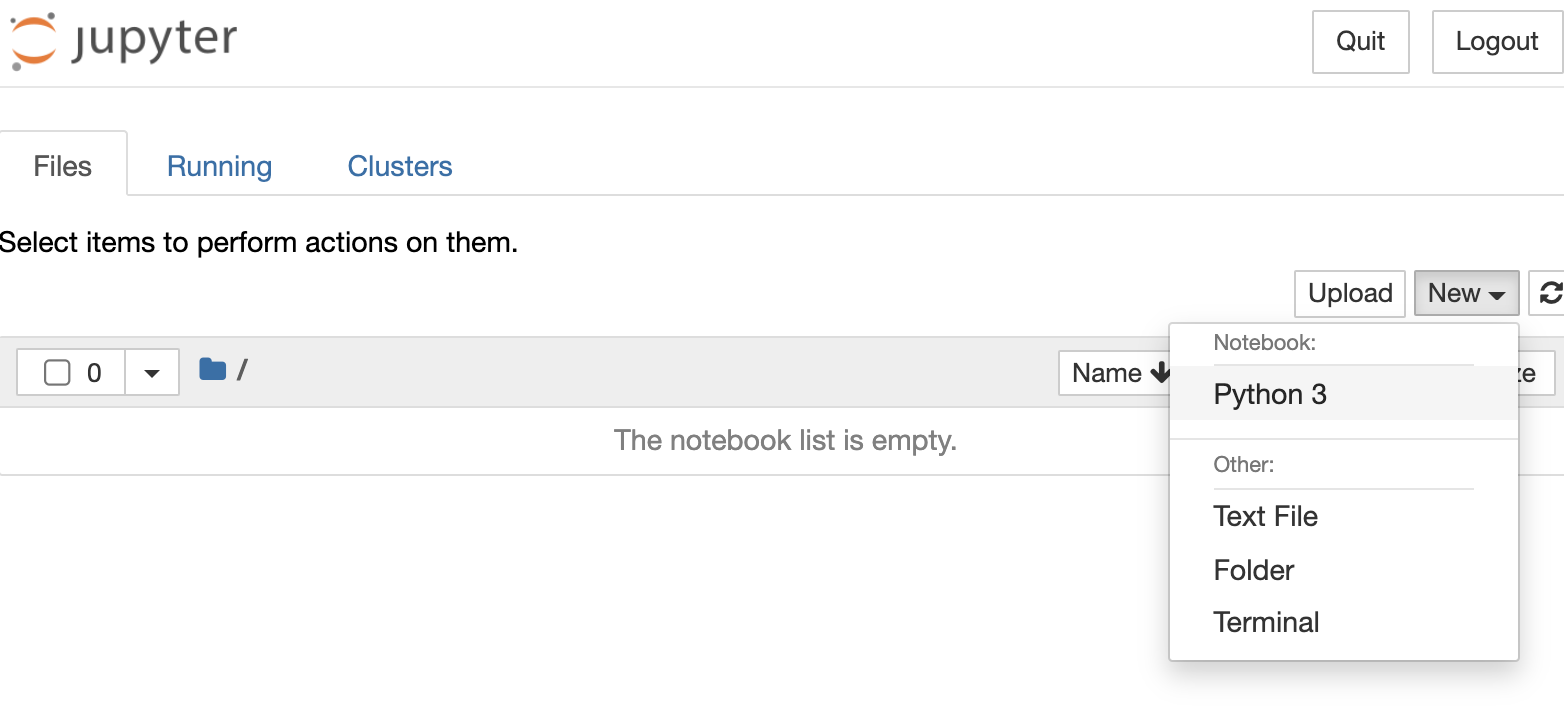
Now, it starts a python kernel on the webserver

1.5.3. A jupyter notebook tour#
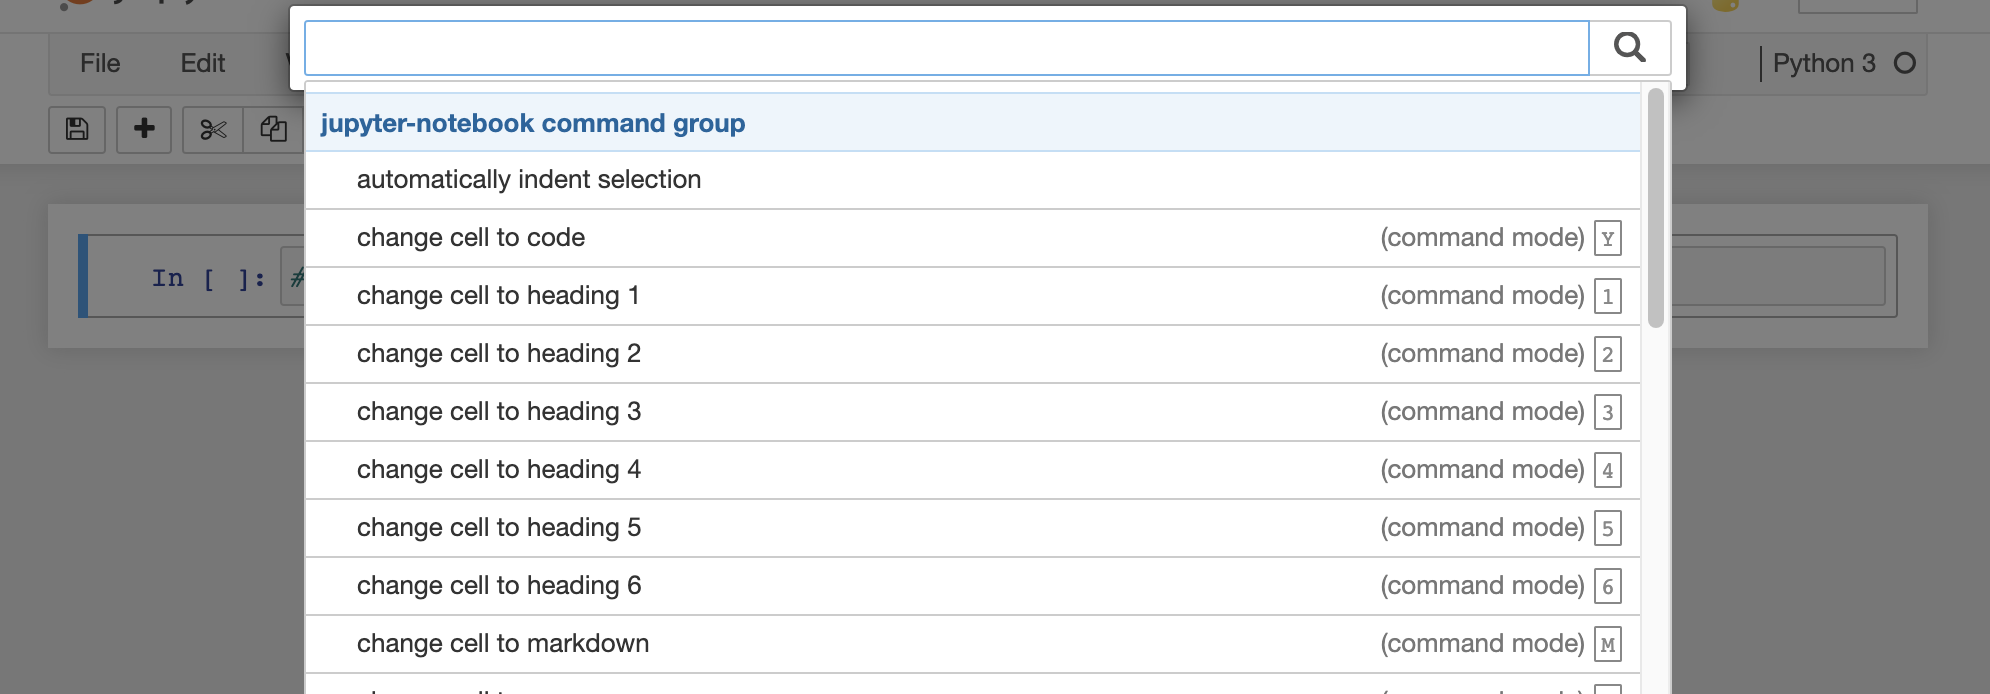
A Jupyter notebook has two modes. When you first open, it is in command mode. The border is blue in command mode.
When you press a key in command mode it works like a shortcut. For example p shows the command search menu.
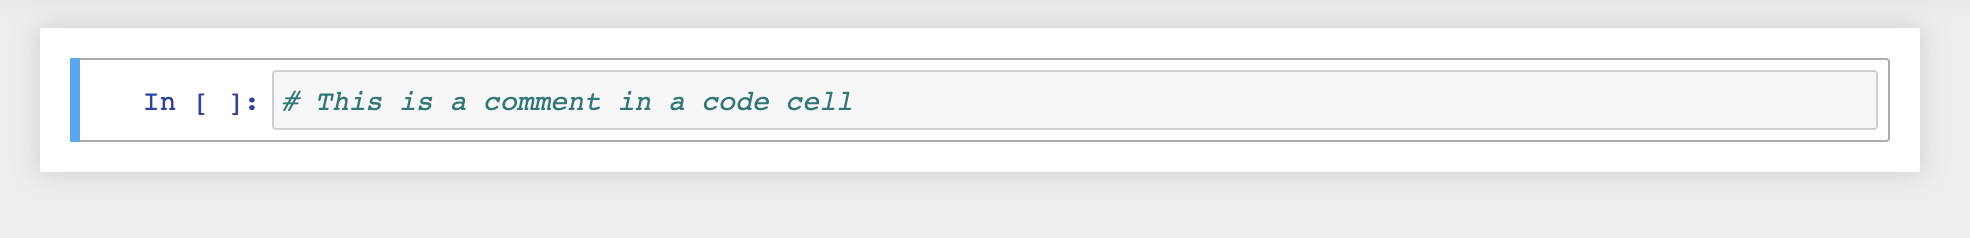
If you press enter (or return) or click on the highlighted cell, which is the boxes we can type in, it changes to edit mode. The border is green in edit mode
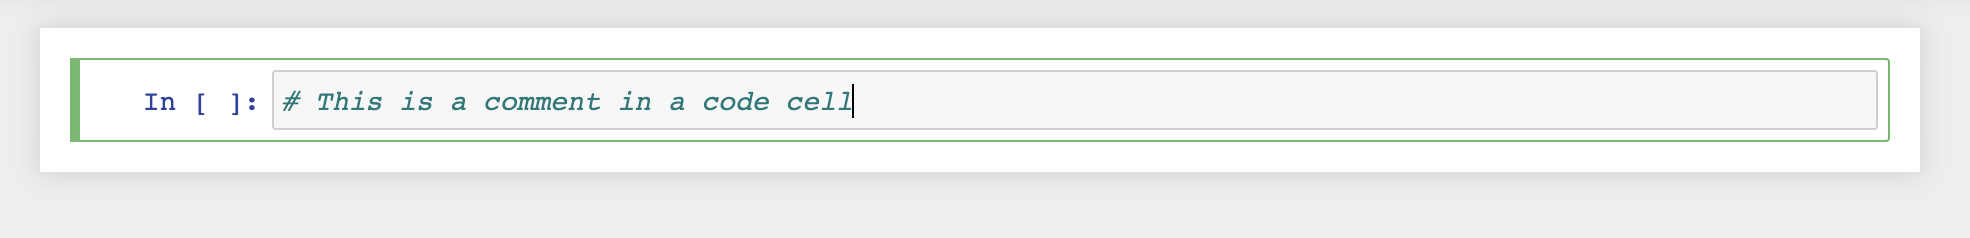
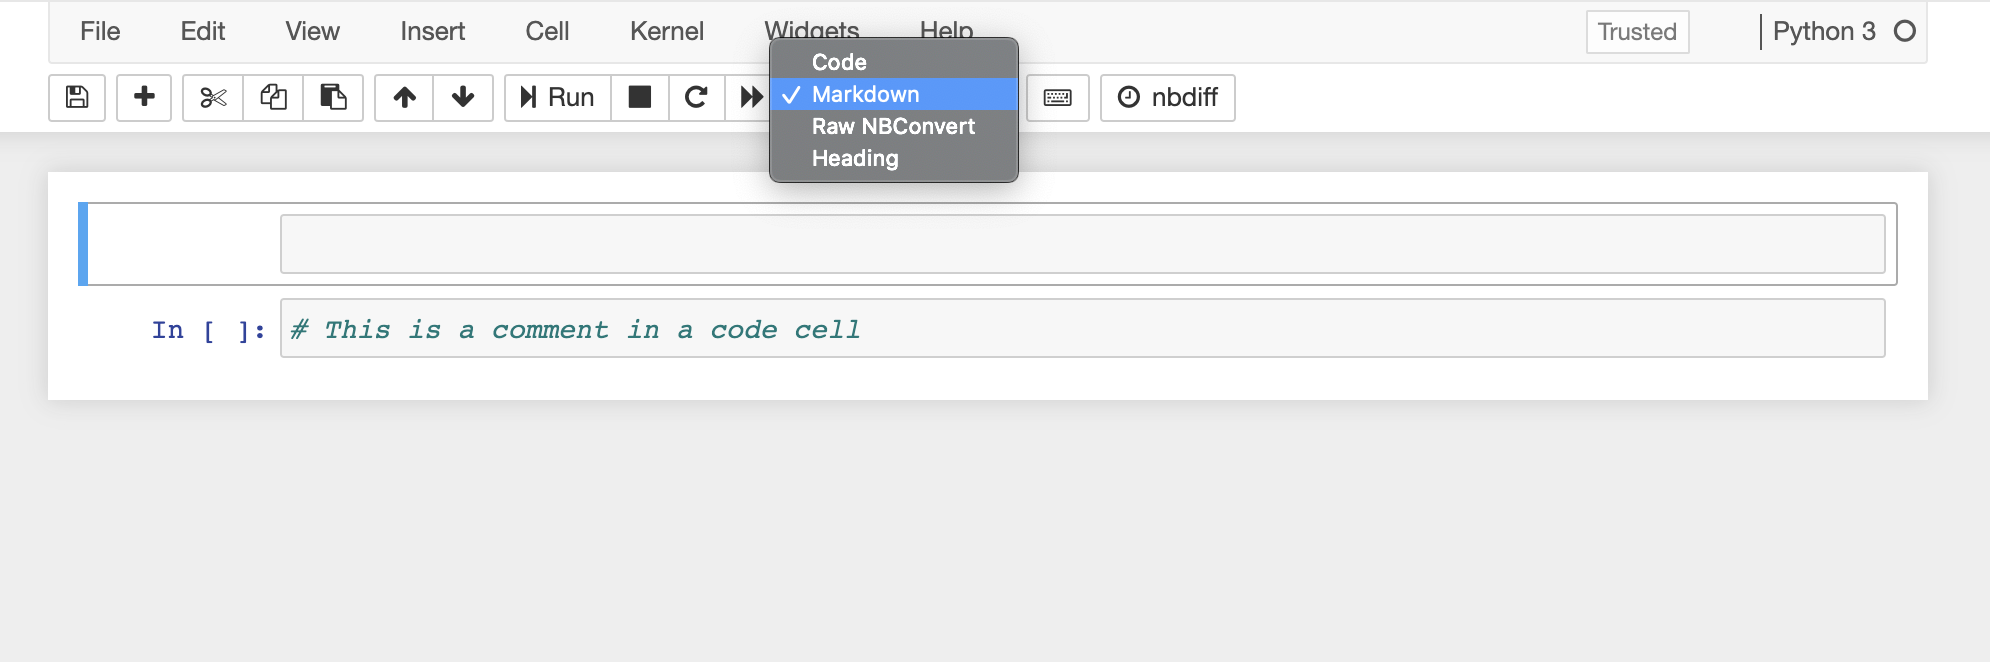
There are two type of cells that we will used: code and markdown. You can change that in command mode with y for code and m for markdown or on the cell type menu at the top of the notebook.
++
This is a markdown cell
we can make
itemized lists of
bullet points
and we can make nubmered
lists, and not have to worry
about renumbering them
if we add a step in the middle later
1.5.4. Notebook Reminders#
Blue border is command mode, green border is edit mode
use Escape to get to command mode
Common command mode actions:
m: switch cell to markdown
y: switch cell to code
a: add a cell above
b: add a cell below
c: copy cell
v: paste the cell
0 + 0: restart kernel
p: command menu
use enter/return to get to edit mode
In code cells, we can use a python interpreter, for example as a calculator.
4+6
10
It prints out the last line of code that it ran, even though it executes all of them
name = 'sarah'
4+5
name *3
'sarahsarahsarah'
1.6. Getting Help in Jupyter#
When your cursor is inside the () of a function if you hodl the shift key and press tab it will open a popup with information.
Python has a print function and we can use the help in jupyter to learn about
how to use it in different ways.
help(print)
Help on built-in function print in module builtins:

print(...)
    print(value, ..., sep=' ', end='\n', file=sys.stdout, flush=False)

    Prints the values to a stream, or to sys.stdout by default.
    Optional keyword arguments:
    file:  a file-like object (stream); defaults to the current sys.stdout.
    sep:   string inserted between values, default a space.
    end:   string appended after the last value, default a newline.
    flush: whether to forcibly flush the stream.
1.7. Course Administration#
We will use GitHub for all course administration.
1.8. Prepare for the next class#
Read carefully the syllabus section of the course website
skim the rest of the course website
Bring questions about how the class will work to class on Friday.
Review Git & GitHub Fundamentals
Bring git/github questions on Friday.
Begin reading chapter 1 of think like a data scientist (finish in time for it to help you with the assignment due Sunday night)
On Friday we will start with a review of the syllabus. You will answer an ungraded quiz to confirm that you understand and I’ll answer all of your questions. Then we will do a little bit with Git/GitHub and start your first assignment in class.
Think like a data scientist is written for practitioners; not as a text book for a class. It does not have a lot of prerequisite background, but the sections of it that I assign will help you build a better mental picture of what doing Data Science about. In chapter 1, focus most on sections 1.1, 1.3, and 1.7.
Only the first assignment will be due this fast, it’s a short review and setup assignment. It’s due quickly so that we know that you have everything set up and the prerequisite material before we start new material next week.
1.9. Questions after class#
1.9.1. Grading#
1.9.1.1. How do the portfolios work? what are the 1/2/3 achievement levels? How is gradint structured?#
Read the syllabus carefully and we will discuss on Friday
1.9.1.2. Will there be any group work?#
Not in the regular sense of collaborative and shared grade. There will be optional collaboration opportunities and in class discussion/troubleshooting together.
1.9.2. Uses for what we cover#
1.9.2.1. How in depth does Data Science go, and what can it be used for in the industry?#
The basic ideas here can be used for any tabular data in industry exactly as we will cover them. At the end of the semester, we will see in less detail how to work with text and images, with a focus on translating what you learned on tabular data (because its low dimensional and easier to see/faster to process) to more complex data.
We’ll talk more about this on Friday and every time we use a new dataset in class.
1.9.2.2. What is the difference between data analytics and data science? Are analysts and scientists jobs different?#
This is a hard question. It varies company to company. It is, however, a topic a lot of Data Science Bloggers write about. If you find some you like, share them on the discussion board or submit a PR.
1.9.3. Logistics#
1.9.3.1. What is the main site#
1.9.3.2. do these prismia chats stay up after class or go away?#
They persist. You can scroll back or get a transcript by clicking the > in the top left, then the 3 bar menu icon and then “Get Transcript From Class”
1.9.4. Tools#
1.9.4.1. Can we open jupyter notebook server without the terminal?#
Yes, you can, but I do not use it that way and they change how that works from time to time, so I can only troubleshoot with you via the terminal.
1.9.4.2. Which IDE to use? Can we use VSCode?#
Your will be required to submit jupyter notebooks that are compatible with some other jupyter related tools I use to process them for grading.
1.9.4.3. Will we all have a single server to have various notebooks for assignments, or will we be required to make different servers for other assignments?#
The jupyter notebook web server is something that you will start and stop many times, each working session you’ll stop it. You can run multiple in parallel or use one and open multiple notebooks.
1.9.4.4. Will we do any web scraping in this class?#
Yes
1.9.4.5. Will we be able to choose our own data sets when doing assignments?#
Yes, with some requirements, on most assignments.