Clustering with Sci-kit Learn
Contents
24. Clustering with Sci-kit Learn#
import seaborn as sns
import numpy as np
from sklearn import datasets
from sklearn.cluster import KMeans
import pandas as pd
sns.set_theme(palette='colorblind')

# set global random seed so that the notes are the same each time the site builds
np.random.seed(1103)
First we will load the iris data from Seaborn
iris_df = sns.load_dataset('iris')
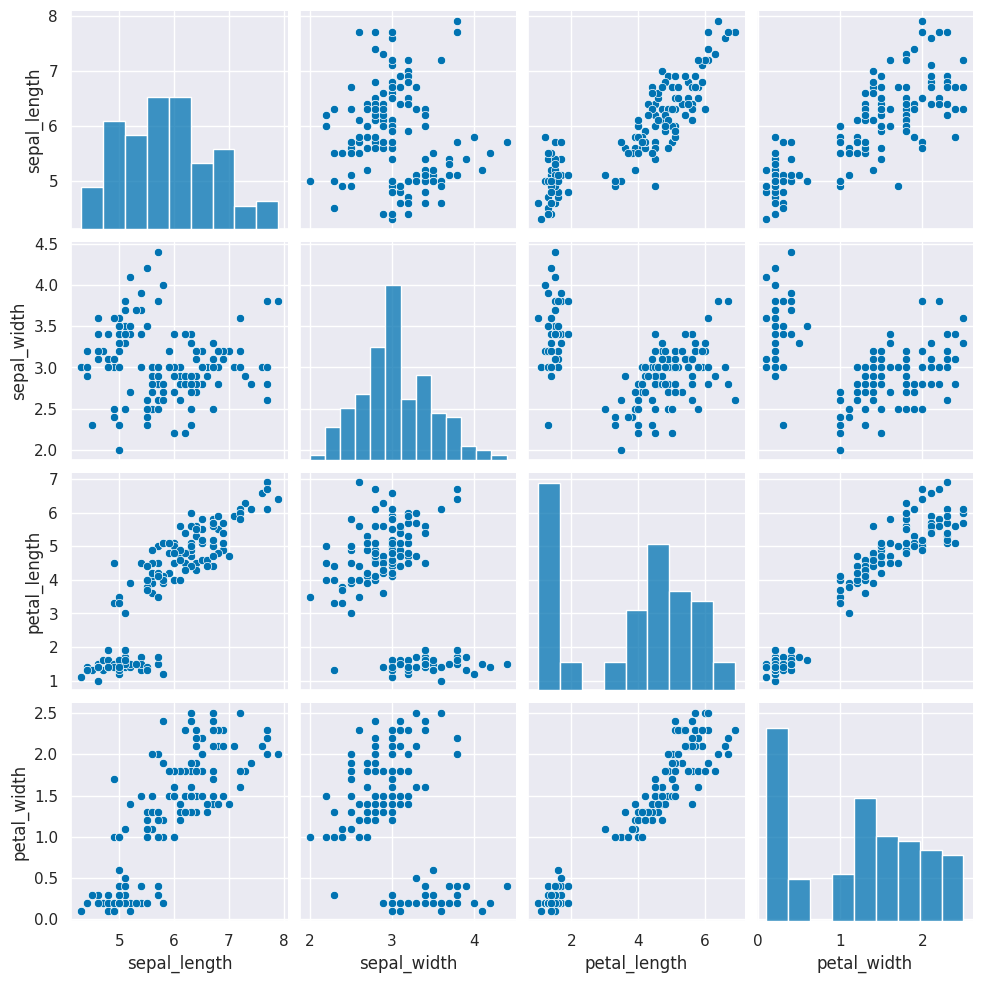
To consider what our clustering algorithm sees, we will plot the grid of subplots without the species labeling the point.s.
sns.pairplot(data=iris_df)
<seaborn.axisgrid.PairGrid at 0x7fe9ac7e7a60>
We need a copy of the data that’s appropriate for clustering. Remember that clustering is unsupervised so it doesn’t have a target variable. We also can do clustering on the data with or without splitting into test/train splits, since it doesn’t use a target variable, we can evaluate how good the clusters it finds are on the actual data that it learned from.
iris_df.head(2)
| sepal_length | sepal_width | petal_length | petal_width | species | |
|---|---|---|---|---|---|
| 0 | 5.1 | 3.5 | 1.4 | 0.2 | setosa |
| 1 | 4.9 | 3.0 | 1.4 | 0.2 | setosa |
Hint
We can either pick the measurements out or drop the species column. remember most data frame operations return a copy of the dataframe.
We’ll do this by dropping the species for now, but we could have also selected the measurement columns.
iris_X = iris_df.drop(columns=['species'])
iris_X.head(1)
| sepal_length | sepal_width | petal_length | petal_width | |
|---|---|---|---|---|
| 0 | 5.1 | 3.5 | 1.4 | 0.2 |
25. KMeans Estimator#
Create a Kmeans estimator object with 3 clusters, since we know that the iris data has 3 species of flowers. We refer to these three groups as classes in classification (the goal is to label the classes…) and in clustering we typically borrow that word. Sometimes, clustering literature will be more abstract and refer to partitions, this is especially common in more mathematical/statistical work as opposed to algorithmic work on clustering.
km = KMeans(n_clusters=3)
we use this to instantiate the object with the right number since we know that is correct.
Question
How do we know there are three classes? didnt’ we just drop them?
We dropped the column that tells us which of the three classes that each sample(row) belongs to. We still have data from three species of flows.
Hint
use shift+tab or another jupyter help to figure out what the parameter names are for any function or class you’re working with.
26. Fit and Predict#
Since we don’t have separate test and train data, we can use the fit_predict method. This is what the kmeans algorithm always does anyway, it both learns the means and the assignment (or prediction) for each sample at the same time. On Monday, that would be the last column of the dataframe, the one in the highest.
km.fit_predict(iris_X)
/opt/hostedtoolcache/Python/3.9.16/x64/lib/python3.9/site-packages/sklearn/cluster/_kmeans.py:870: FutureWarning: The default value of `n_init` will change from 10 to 'auto' in 1.4. Set the value of `n_init` explicitly to suppress the warning
  warnings.warn(
array([0, 0, 0, 0, 0, 0, 0, 0, 0, 0, 0, 0, 0, 0, 0, 0, 0, 0, 0, 0, 0, 0,
       0, 0, 0, 0, 0, 0, 0, 0, 0, 0, 0, 0, 0, 0, 0, 0, 0, 0, 0, 0, 0, 0,
       0, 0, 0, 0, 0, 0, 1, 1, 2, 1, 1, 1, 1, 1, 1, 1, 1, 1, 1, 1, 1, 1,
       1, 1, 1, 1, 1, 1, 1, 1, 1, 1, 1, 2, 1, 1, 1, 1, 1, 1, 1, 1, 1, 1,
       1, 1, 1, 1, 1, 1, 1, 1, 1, 1, 1, 1, 2, 1, 2, 2, 2, 2, 1, 2, 2, 2,
       2, 2, 2, 1, 1, 2, 2, 2, 2, 1, 2, 1, 2, 1, 2, 2, 1, 1, 2, 2, 2, 2,
       2, 1, 2, 2, 2, 2, 1, 2, 2, 2, 1, 2, 2, 2, 1, 2, 2, 1], dtype=int32)
iris_df['species'].values
array(['setosa', 'setosa', 'setosa', 'setosa', 'setosa', 'setosa',
       'setosa', 'setosa', 'setosa', 'setosa', 'setosa', 'setosa',
       'setosa', 'setosa', 'setosa', 'setosa', 'setosa', 'setosa',
       'setosa', 'setosa', 'setosa', 'setosa', 'setosa', 'setosa',
       'setosa', 'setosa', 'setosa', 'setosa', 'setosa', 'setosa',
       'setosa', 'setosa', 'setosa', 'setosa', 'setosa', 'setosa',
       'setosa', 'setosa', 'setosa', 'setosa', 'setosa', 'setosa',
       'setosa', 'setosa', 'setosa', 'setosa', 'setosa', 'setosa',
       'setosa', 'setosa', 'versicolor', 'versicolor', 'versicolor',
       'versicolor', 'versicolor', 'versicolor', 'versicolor',
       'versicolor', 'versicolor', 'versicolor', 'versicolor',
       'versicolor', 'versicolor', 'versicolor', 'versicolor',
       'versicolor', 'versicolor', 'versicolor', 'versicolor',
       'versicolor', 'versicolor', 'versicolor', 'versicolor',
       'versicolor', 'versicolor', 'versicolor', 'versicolor',
       'versicolor', 'versicolor', 'versicolor', 'versicolor',
       'versicolor', 'versicolor', 'versicolor', 'versicolor',
       'versicolor', 'versicolor', 'versicolor', 'versicolor',
       'versicolor', 'versicolor', 'versicolor', 'versicolor',
       'versicolor', 'versicolor', 'versicolor', 'versicolor',
       'versicolor', 'versicolor', 'versicolor', 'virginica', 'virginica',
       'virginica', 'virginica', 'virginica', 'virginica', 'virginica',
       'virginica', 'virginica', 'virginica', 'virginica', 'virginica',
       'virginica', 'virginica', 'virginica', 'virginica', 'virginica',
       'virginica', 'virginica', 'virginica', 'virginica', 'virginica',
       'virginica', 'virginica', 'virginica', 'virginica', 'virginica',
       'virginica', 'virginica', 'virginica', 'virginica', 'virginica',
       'virginica', 'virginica', 'virginica', 'virginica', 'virginica',
       'virginica', 'virginica', 'virginica', 'virginica', 'virginica',
       'virginica', 'virginica', 'virginica', 'virginica', 'virginica',
       'virginica', 'virginica', 'virginica'], dtype=object)
This gives the labeled cluster by index, or the assignment, of each point.
These are similar to the outputs in classification, except that in classification, it’s able to tell us a specific species for each. Here it can only say clust 0, 1, or 2. It can’t match those groups to the species of flower.
Now that we know what these are, we can save them to a variable.
cluster_assignments = km.fit_predict(iris_X)
cluster_assignments
/opt/hostedtoolcache/Python/3.9.16/x64/lib/python3.9/site-packages/sklearn/cluster/_kmeans.py:870: FutureWarning: The default value of `n_init` will change from 10 to 'auto' in 1.4. Set the value of `n_init` explicitly to suppress the warning
  warnings.warn(
array([0, 0, 0, 0, 0, 0, 0, 0, 0, 0, 0, 0, 0, 0, 0, 0, 0, 0, 0, 0, 0, 0,
       0, 0, 0, 0, 0, 0, 0, 0, 0, 0, 0, 0, 0, 0, 0, 0, 0, 0, 0, 0, 0, 0,
       0, 0, 0, 0, 0, 0, 1, 1, 2, 1, 1, 1, 1, 1, 1, 1, 1, 1, 1, 1, 1, 1,
       1, 1, 1, 1, 1, 1, 1, 1, 1, 1, 1, 2, 1, 1, 1, 1, 1, 1, 1, 1, 1, 1,
       1, 1, 1, 1, 1, 1, 1, 1, 1, 1, 1, 1, 2, 1, 2, 2, 2, 2, 1, 2, 2, 2,
       2, 2, 2, 1, 1, 2, 2, 2, 2, 1, 2, 1, 2, 1, 2, 2, 1, 1, 2, 2, 2, 2,
       2, 1, 2, 2, 2, 2, 1, 2, 2, 2, 1, 2, 2, 2, 1, 2, 2, 1], dtype=int32)
Use the get_params method to look at the parameters. Read the documentation to see what they mean.
km.get_params(deep=True)
{'algorithm': 'lloyd',
 'copy_x': True,
 'init': 'k-means++',
 'max_iter': 300,
 'n_clusters': 3,
 'n_init': 'warn',
 'random_state': None,
 'tol': 0.0001,
 'verbose': 0}
27. Visualizing the outputs#
Add the predictions as a new column to the original iris_df and make a pairplot with the points colored by what the clustering learned.
iris_df['km1'] = cluster_assignments
sns.pairplot(data=iris_df,hue='km1')
---------------------------------------------------------------------------
TypeError                                 Traceback (most recent call last)
Cell In[11], line 2
      1 iris_df['km1'] = cluster_assignments
----> 2 sns.pairplot(data=iris_df,hue='km1')

File /opt/hostedtoolcache/Python/3.9.16/x64/lib/python3.9/site-packages/seaborn/axisgrid.py:2148, in pairplot(data, hue, hue_order, palette, vars, x_vars, y_vars, kind, diag_kind, markers, height, aspect, corner, dropna, plot_kws, diag_kws, grid_kws, size)
   2146     diag_kws.setdefault("fill", True)
   2147     diag_kws.setdefault("warn_singular", False)
-> 2148     grid.map_diag(kdeplot, **diag_kws)
   2150 # Maybe plot on the off-diagonals
   2151 if diag_kind is not None:

File /opt/hostedtoolcache/Python/3.9.16/x64/lib/python3.9/site-packages/seaborn/axisgrid.py:1507, in PairGrid.map_diag(self, func, **kwargs)
   1505     plot_kwargs.setdefault("hue_order", self._hue_order)
   1506     plot_kwargs.setdefault("palette", self._orig_palette)
-> 1507     func(x=vector, **plot_kwargs)
   1508     ax.legend_ = None
   1510 self._add_axis_labels()

File /opt/hostedtoolcache/Python/3.9.16/x64/lib/python3.9/site-packages/seaborn/distributions.py:1717, in kdeplot(data, x, y, hue, weights, palette, hue_order, hue_norm, color, fill, multiple, common_norm, common_grid, cumulative, bw_method, bw_adjust, warn_singular, log_scale, levels, thresh, gridsize, cut, clip, legend, cbar, cbar_ax, cbar_kws, ax, **kwargs)
   1713 if p.univariate:
   1715     plot_kws = kwargs.copy()
-> 1717     p.plot_univariate_density(
   1718         multiple=multiple,
   1719         common_norm=common_norm,
   1720         common_grid=common_grid,
   1721         fill=fill,
   1722         color=color,
   1723         legend=legend,
   1724         warn_singular=warn_singular,
   1725         estimate_kws=estimate_kws,
   1726         **plot_kws,
   1727     )
   1729 else:
   1731     p.plot_bivariate_density(
   1732         common_norm=common_norm,
   1733         fill=fill,
   (...)
   1743         **kwargs,
   1744     )

File /opt/hostedtoolcache/Python/3.9.16/x64/lib/python3.9/site-packages/seaborn/distributions.py:996, in _DistributionPlotter.plot_univariate_density(self, multiple, common_norm, common_grid, warn_singular, fill, color, legend, estimate_kws, **plot_kws)
    993 if "x" in self.variables:
    995     if fill:
--> 996         artist = ax.fill_between(support, fill_from, density, **artist_kws)
    998     else:
    999         artist, = ax.plot(support, density, **artist_kws)

File /opt/hostedtoolcache/Python/3.9.16/x64/lib/python3.9/site-packages/matplotlib/__init__.py:1423, in _preprocess_data.<locals>.inner(ax, data, *args, **kwargs)
   1420 @functools.wraps(func)
   1421 def inner(ax, *args, data=None, **kwargs):
   1422     if data is None:
-> 1423         return func(ax, *map(sanitize_sequence, args), **kwargs)
   1425     bound = new_sig.bind(ax, *args, **kwargs)
   1426     auto_label = (bound.arguments.get(label_namer)
   1427                   or bound.kwargs.get(label_namer))

File /opt/hostedtoolcache/Python/3.9.16/x64/lib/python3.9/site-packages/matplotlib/axes/_axes.py:5367, in Axes.fill_between(self, x, y1, y2, where, interpolate, step, **kwargs)
   5365 def fill_between(self, x, y1, y2=0, where=None, interpolate=False,
   5366                  step=None, **kwargs):
-> 5367     return self._fill_between_x_or_y(
   5368         "x", x, y1, y2,
   5369         where=where, interpolate=interpolate, step=step, **kwargs)

File /opt/hostedtoolcache/Python/3.9.16/x64/lib/python3.9/site-packages/matplotlib/axes/_axes.py:5272, in Axes._fill_between_x_or_y(self, ind_dir, ind, dep1, dep2, where, interpolate, step, **kwargs)
   5268         kwargs["facecolor"] = \
   5269             self._get_patches_for_fill.get_next_color()
   5271 # Handle united data, such as dates
-> 5272 ind, dep1, dep2 = map(
   5273     ma.masked_invalid, self._process_unit_info(
   5274         [(ind_dir, ind), (dep_dir, dep1), (dep_dir, dep2)], kwargs))
   5276 for name, array in [
   5277         (ind_dir, ind), (f"{dep_dir}1", dep1), (f"{dep_dir}2", dep2)]:
   5278     if array.ndim > 1:

File /opt/hostedtoolcache/Python/3.9.16/x64/lib/python3.9/site-packages/numpy/ma/core.py:2360, in masked_invalid(a, copy)
   2332 def masked_invalid(a, copy=True):
   2333     """
   2334     Mask an array where invalid values occur (NaNs or infs).
   2335
   (...)
   2357
   2358     """
-> 2360     return masked_where(~(np.isfinite(getdata(a))), a, copy=copy)

TypeError: ufunc 'isfinite' not supported for the input types, and the inputs could not be safely coerced to any supported types according to the casting rule ''safe''
iris_df['km2'] = km.fit_predict(iris_X)
/opt/hostedtoolcache/Python/3.9.16/x64/lib/python3.9/site-packages/sklearn/cluster/_kmeans.py:870: FutureWarning: The default value of `n_init` will change from 10 to 'auto' in 1.4. Set the value of `n_init` explicitly to suppress the warning
  warnings.warn(
iris_df.head(1)
| sepal_length | sepal_width | petal_length | petal_width | species | km1 | km2 | |
|---|---|---|---|---|---|---|---|
| 0 | 5.1 | 3.5 | 1.4 | 0.2 | setosa | 0 | 1 |
measurement_cols = ['sepal_length','petal_length','sepal_width','petal_width']
We need to pick out only the measurement columns for plotting. The way have done this in the past is to subset the dataFrame
sns.pairplot(iris_df[measurement_cols+['km2']],hue='km2')
---------------------------------------------------------------------------
TypeError                                 Traceback (most recent call last)
Cell In[15], line 1
----> 1 sns.pairplot(iris_df[measurement_cols+['km2']],hue='km2')

File /opt/hostedtoolcache/Python/3.9.16/x64/lib/python3.9/site-packages/seaborn/axisgrid.py:2148, in pairplot(data, hue, hue_order, palette, vars, x_vars, y_vars, kind, diag_kind, markers, height, aspect, corner, dropna, plot_kws, diag_kws, grid_kws, size)
   2146     diag_kws.setdefault("fill", True)
   2147     diag_kws.setdefault("warn_singular", False)
-> 2148     grid.map_diag(kdeplot, **diag_kws)
   2150 # Maybe plot on the off-diagonals
   2151 if diag_kind is not None:

File /opt/hostedtoolcache/Python/3.9.16/x64/lib/python3.9/site-packages/seaborn/axisgrid.py:1507, in PairGrid.map_diag(self, func, **kwargs)
   1505     plot_kwargs.setdefault("hue_order", self._hue_order)
   1506     plot_kwargs.setdefault("palette", self._orig_palette)
-> 1507     func(x=vector, **plot_kwargs)
   1508     ax.legend_ = None
   1510 self._add_axis_labels()

File /opt/hostedtoolcache/Python/3.9.16/x64/lib/python3.9/site-packages/seaborn/distributions.py:1717, in kdeplot(data, x, y, hue, weights, palette, hue_order, hue_norm, color, fill, multiple, common_norm, common_grid, cumulative, bw_method, bw_adjust, warn_singular, log_scale, levels, thresh, gridsize, cut, clip, legend, cbar, cbar_ax, cbar_kws, ax, **kwargs)
   1713 if p.univariate:
   1715     plot_kws = kwargs.copy()
-> 1717     p.plot_univariate_density(
   1718         multiple=multiple,
   1719         common_norm=common_norm,
   1720         common_grid=common_grid,
   1721         fill=fill,
   1722         color=color,
   1723         legend=legend,
   1724         warn_singular=warn_singular,
   1725         estimate_kws=estimate_kws,
   1726         **plot_kws,
   1727     )
   1729 else:
   1731     p.plot_bivariate_density(
   1732         common_norm=common_norm,
   1733         fill=fill,
   (...)
   1743         **kwargs,
   1744     )

File /opt/hostedtoolcache/Python/3.9.16/x64/lib/python3.9/site-packages/seaborn/distributions.py:996, in _DistributionPlotter.plot_univariate_density(self, multiple, common_norm, common_grid, warn_singular, fill, color, legend, estimate_kws, **plot_kws)
    993 if "x" in self.variables:
    995     if fill:
--> 996         artist = ax.fill_between(support, fill_from, density, **artist_kws)
    998     else:
    999         artist, = ax.plot(support, density, **artist_kws)

File /opt/hostedtoolcache/Python/3.9.16/x64/lib/python3.9/site-packages/matplotlib/__init__.py:1423, in _preprocess_data.<locals>.inner(ax, data, *args, **kwargs)
   1420 @functools.wraps(func)
   1421 def inner(ax, *args, data=None, **kwargs):
   1422     if data is None:
-> 1423         return func(ax, *map(sanitize_sequence, args), **kwargs)
   1425     bound = new_sig.bind(ax, *args, **kwargs)
   1426     auto_label = (bound.arguments.get(label_namer)
   1427                   or bound.kwargs.get(label_namer))

File /opt/hostedtoolcache/Python/3.9.16/x64/lib/python3.9/site-packages/matplotlib/axes/_axes.py:5367, in Axes.fill_between(self, x, y1, y2, where, interpolate, step, **kwargs)
   5365 def fill_between(self, x, y1, y2=0, where=None, interpolate=False,
   5366                  step=None, **kwargs):
-> 5367     return self._fill_between_x_or_y(
   5368         "x", x, y1, y2,
   5369         where=where, interpolate=interpolate, step=step, **kwargs)

File /opt/hostedtoolcache/Python/3.9.16/x64/lib/python3.9/site-packages/matplotlib/axes/_axes.py:5272, in Axes._fill_between_x_or_y(self, ind_dir, ind, dep1, dep2, where, interpolate, step, **kwargs)
   5268         kwargs["facecolor"] = \
   5269             self._get_patches_for_fill.get_next_color()
   5271 # Handle united data, such as dates
-> 5272 ind, dep1, dep2 = map(
   5273     ma.masked_invalid, self._process_unit_info(
   5274         [(ind_dir, ind), (dep_dir, dep1), (dep_dir, dep2)], kwargs))
   5276 for name, array in [
   5277         (ind_dir, ind), (f"{dep_dir}1", dep1), (f"{dep_dir}2", dep2)]:
   5278     if array.ndim > 1:

File /opt/hostedtoolcache/Python/3.9.16/x64/lib/python3.9/site-packages/numpy/ma/core.py:2360, in masked_invalid(a, copy)
   2332 def masked_invalid(a, copy=True):
   2333     """
   2334     Mask an array where invalid values occur (NaNs or infs).
   2335
   (...)
   2357
   2358     """
-> 2360     return masked_where(~(np.isfinite(getdata(a))), a, copy=copy)

TypeError: ufunc 'isfinite' not supported for the input types, and the inputs could not be safely coerced to any supported types according to the casting rule ''safe''
We can use the vars parameter to plot only the measurement columns and not the cluster labels. We didn’t have to do this before, because species is strings, but the cluster predictions are also numerical, so by default seaborn plots them.
sns.pairplot(data=iris_df, hue='km2', vars=measurement_cols)
---------------------------------------------------------------------------
TypeError                                 Traceback (most recent call last)
Cell In[16], line 1
----> 1 sns.pairplot(data=iris_df, hue='km2', vars=measurement_cols)

File /opt/hostedtoolcache/Python/3.9.16/x64/lib/python3.9/site-packages/seaborn/axisgrid.py:2148, in pairplot(data, hue, hue_order, palette, vars, x_vars, y_vars, kind, diag_kind, markers, height, aspect, corner, dropna, plot_kws, diag_kws, grid_kws, size)
   2146     diag_kws.setdefault("fill", True)
   2147     diag_kws.setdefault("warn_singular", False)
-> 2148     grid.map_diag(kdeplot, **diag_kws)
   2150 # Maybe plot on the off-diagonals
   2151 if diag_kind is not None:

File /opt/hostedtoolcache/Python/3.9.16/x64/lib/python3.9/site-packages/seaborn/axisgrid.py:1507, in PairGrid.map_diag(self, func, **kwargs)
   1505     plot_kwargs.setdefault("hue_order", self._hue_order)
   1506     plot_kwargs.setdefault("palette", self._orig_palette)
-> 1507     func(x=vector, **plot_kwargs)
   1508     ax.legend_ = None
   1510 self._add_axis_labels()

File /opt/hostedtoolcache/Python/3.9.16/x64/lib/python3.9/site-packages/seaborn/distributions.py:1717, in kdeplot(data, x, y, hue, weights, palette, hue_order, hue_norm, color, fill, multiple, common_norm, common_grid, cumulative, bw_method, bw_adjust, warn_singular, log_scale, levels, thresh, gridsize, cut, clip, legend, cbar, cbar_ax, cbar_kws, ax, **kwargs)
   1713 if p.univariate:
   1715     plot_kws = kwargs.copy()
-> 1717     p.plot_univariate_density(
   1718         multiple=multiple,
   1719         common_norm=common_norm,
   1720         common_grid=common_grid,
   1721         fill=fill,
   1722         color=color,
   1723         legend=legend,
   1724         warn_singular=warn_singular,
   1725         estimate_kws=estimate_kws,
   1726         **plot_kws,
   1727     )
   1729 else:
   1731     p.plot_bivariate_density(
   1732         common_norm=common_norm,
   1733         fill=fill,
   (...)
   1743         **kwargs,
   1744     )

File /opt/hostedtoolcache/Python/3.9.16/x64/lib/python3.9/site-packages/seaborn/distributions.py:996, in _DistributionPlotter.plot_univariate_density(self, multiple, common_norm, common_grid, warn_singular, fill, color, legend, estimate_kws, **plot_kws)
    993 if "x" in self.variables:
    995     if fill:
--> 996         artist = ax.fill_between(support, fill_from, density, **artist_kws)
    998     else:
    999         artist, = ax.plot(support, density, **artist_kws)

File /opt/hostedtoolcache/Python/3.9.16/x64/lib/python3.9/site-packages/matplotlib/__init__.py:1423, in _preprocess_data.<locals>.inner(ax, data, *args, **kwargs)
   1420 @functools.wraps(func)
   1421 def inner(ax, *args, data=None, **kwargs):
   1422     if data is None:
-> 1423         return func(ax, *map(sanitize_sequence, args), **kwargs)
   1425     bound = new_sig.bind(ax, *args, **kwargs)
   1426     auto_label = (bound.arguments.get(label_namer)
   1427                   or bound.kwargs.get(label_namer))

File /opt/hostedtoolcache/Python/3.9.16/x64/lib/python3.9/site-packages/matplotlib/axes/_axes.py:5367, in Axes.fill_between(self, x, y1, y2, where, interpolate, step, **kwargs)
   5365 def fill_between(self, x, y1, y2=0, where=None, interpolate=False,
   5366                  step=None, **kwargs):
-> 5367     return self._fill_between_x_or_y(
   5368         "x", x, y1, y2,
   5369         where=where, interpolate=interpolate, step=step, **kwargs)

File /opt/hostedtoolcache/Python/3.9.16/x64/lib/python3.9/site-packages/matplotlib/axes/_axes.py:5272, in Axes._fill_between_x_or_y(self, ind_dir, ind, dep1, dep2, where, interpolate, step, **kwargs)
   5268         kwargs["facecolor"] = \
   5269             self._get_patches_for_fill.get_next_color()
   5271 # Handle united data, such as dates
-> 5272 ind, dep1, dep2 = map(
   5273     ma.masked_invalid, self._process_unit_info(
   5274         [(ind_dir, ind), (dep_dir, dep1), (dep_dir, dep2)], kwargs))
   5276 for name, array in [
   5277         (ind_dir, ind), (f"{dep_dir}1", dep1), (f"{dep_dir}2", dep2)]:
   5278     if array.ndim > 1:

File /opt/hostedtoolcache/Python/3.9.16/x64/lib/python3.9/site-packages/numpy/ma/core.py:2360, in masked_invalid(a, copy)
   2332 def masked_invalid(a, copy=True):
   2333     """
   2334     Mask an array where invalid values occur (NaNs or infs).
   2335
   (...)
   2357
   2358     """
-> 2360     return masked_where(~(np.isfinite(getdata(a))), a, copy=copy)

TypeError: ufunc 'isfinite' not supported for the input types, and the inputs could not be safely coerced to any supported types according to the casting rule ''safe''

28. Clustering Persistence#
We can run kmeans a few more times and plot each time and/or compare with a neighbor/ another group.
for i in [3,4,5,6,7]:
    iris_df['km' + str(i)] = km.fit_predict(iris_X)
/opt/hostedtoolcache/Python/3.9.16/x64/lib/python3.9/site-packages/sklearn/cluster/_kmeans.py:870: FutureWarning: The default value of `n_init` will change from 10 to 'auto' in 1.4. Set the value of `n_init` explicitly to suppress the warning
  warnings.warn(
/opt/hostedtoolcache/Python/3.9.16/x64/lib/python3.9/site-packages/sklearn/cluster/_kmeans.py:870: FutureWarning: The default value of `n_init` will change from 10 to 'auto' in 1.4. Set the value of `n_init` explicitly to suppress the warning
  warnings.warn(
/opt/hostedtoolcache/Python/3.9.16/x64/lib/python3.9/site-packages/sklearn/cluster/_kmeans.py:870: FutureWarning: The default value of `n_init` will change from 10 to 'auto' in 1.4. Set the value of `n_init` explicitly to suppress the warning
  warnings.warn(
/opt/hostedtoolcache/Python/3.9.16/x64/lib/python3.9/site-packages/sklearn/cluster/_kmeans.py:870: FutureWarning: The default value of `n_init` will change from 10 to 'auto' in 1.4. Set the value of `n_init` explicitly to suppress the warning
  warnings.warn(
/opt/hostedtoolcache/Python/3.9.16/x64/lib/python3.9/site-packages/sklearn/cluster/_kmeans.py:870: FutureWarning: The default value of `n_init` will change from 10 to 'auto' in 1.4. Set the value of `n_init` explicitly to suppress the warning
  warnings.warn(
iris_df.sample(10)
| sepal_length | sepal_width | petal_length | petal_width | species | km1 | km2 | km3 | km4 | km5 | km6 | km7 | |
|---|---|---|---|---|---|---|---|---|---|---|---|---|
| 116 | 6.5 | 3.0 | 5.5 | 1.8 | virginica | 2 | 2 | 2 | 2 | 2 | 2 | 2 |
| 92 | 5.8 | 2.6 | 4.0 | 1.2 | versicolor | 1 | 0 | 1 | 1 | 0 | 1 | 1 |
| 34 | 4.9 | 3.1 | 1.5 | 0.2 | setosa | 0 | 1 | 0 | 0 | 1 | 0 | 0 |
| 7 | 5.0 | 3.4 | 1.5 | 0.2 | setosa | 0 | 1 | 0 | 0 | 1 | 0 | 0 |
| 132 | 6.4 | 2.8 | 5.6 | 2.2 | virginica | 2 | 2 | 2 | 2 | 2 | 2 | 2 |
| 55 | 5.7 | 2.8 | 4.5 | 1.3 | versicolor | 1 | 0 | 1 | 1 | 0 | 1 | 1 |
| 45 | 4.8 | 3.0 | 1.4 | 0.3 | setosa | 0 | 1 | 0 | 0 | 1 | 0 | 0 |
| 96 | 5.7 | 2.9 | 4.2 | 1.3 | versicolor | 1 | 0 | 1 | 1 | 0 | 1 | 1 |
| 99 | 5.7 | 2.8 | 4.1 | 1.3 | versicolor | 1 | 0 | 1 | 1 | 0 | 1 | 1 |
| 141 | 6.9 | 3.1 | 5.1 | 2.3 | virginica | 2 | 2 | 2 | 2 | 2 | 2 | 2 |
The grouping of the points stay the same across different runs, but which color each group gets assigned to changes. Look at the 5th time compared to the ones before and 6 compared to that. Which blob is which color changes.
Today, we saw that the clustering solution was pretty similar each time in terms of which points were grouped together, but the labeling of the groups (which one was each number) was different each time. We also saw that clustering can only number the clusters, it can’t match them with certainty to the species. This makes evaluating clustering somewhat different, so we need new metrics.
What might be our goal for evaluating clustering? We’ll start from evaluating clustering on Friday.
29. Question After Class#
29.1. How can we examine if the groups are the same each time?#
One way using what we have already seen is to do it visually.
We could also groupby one of the km columns and then look at the std of the others.
iris_df.groupby('km1').std()
/tmp/ipykernel_2464/2783782698.py:1: FutureWarning: The default value of numeric_only in DataFrameGroupBy.std is deprecated. In a future version, numeric_only will default to False. Either specify numeric_only or select only columns which should be valid for the function.
  iris_df.groupby('km1').std()
| sepal_length | sepal_width | petal_length | petal_width | km2 | km3 | km4 | km5 | km6 | km7 | |
|---|---|---|---|---|---|---|---|---|---|---|
| km1 | ||||||||||
| 0 | 0.352490 | 0.379064 | 0.173664 | 0.105386 | 0.0 | 0.0 | 0.0 | 0.0 | 0.0 | 0.0 |
| 1 | 0.466410 | 0.296284 | 0.508895 | 0.297500 | 0.0 | 0.0 | 0.0 | 0.0 | 0.0 | 0.0 |
| 2 | 0.494155 | 0.290092 | 0.488590 | 0.279872 | 0.0 | 0.0 | 0.0 | 0.0 | 0.0 | 0.0 |