Decision Trees
Contents
18. Decision Trees#
%matplotlib inline
import pandas as pd
import seaborn as sns
import numpy as np
from sklearn import tree
import matplotlib.pyplot as plt
from sklearn.model_selection import train_test_split
from sklearn.naive_bayes import GaussianNB
from sklearn import metrics
sns.set(palette='colorblind') # this improves contrast

from sklearn.metrics import confusion_matrix, classification_report
18.1. Let’s look at a toy dataset#
Using a toy dataset here shows an easy to see challenge for the classifier that we have seen so far. Real datasets will be hard in different ways, and since they’re higher dimensional, it’s harder to visualize the cause.
corner_data = 'https://raw.githubusercontent.com/rhodyprog4ds/06-naive-bayes/f425ba121cc0c4dd8bcaa7ebb2ff0b40b0b03bff/data/dataset6.csv'
df6= pd.read_csv(corner_data,usecols=[1,2,3])
gnb = GaussianNB()
sns.pairplot(data=df6, hue='char',hue_order=['A','B'])
---------------------------------------------------------------------------
TypeError                                 Traceback (most recent call last)
Cell In[5], line 1
----> 1 sns.pairplot(data=df6, hue='char',hue_order=['A','B'])

File /opt/hostedtoolcache/Python/3.9.16/x64/lib/python3.9/site-packages/seaborn/axisgrid.py:2148, in pairplot(data, hue, hue_order, palette, vars, x_vars, y_vars, kind, diag_kind, markers, height, aspect, corner, dropna, plot_kws, diag_kws, grid_kws, size)
   2146     diag_kws.setdefault("fill", True)
   2147     diag_kws.setdefault("warn_singular", False)
-> 2148     grid.map_diag(kdeplot, **diag_kws)
   2150 # Maybe plot on the off-diagonals
   2151 if diag_kind is not None:

File /opt/hostedtoolcache/Python/3.9.16/x64/lib/python3.9/site-packages/seaborn/axisgrid.py:1507, in PairGrid.map_diag(self, func, **kwargs)
   1505     plot_kwargs.setdefault("hue_order", self._hue_order)
   1506     plot_kwargs.setdefault("palette", self._orig_palette)
-> 1507     func(x=vector, **plot_kwargs)
   1508     ax.legend_ = None
   1510 self._add_axis_labels()

File /opt/hostedtoolcache/Python/3.9.16/x64/lib/python3.9/site-packages/seaborn/distributions.py:1717, in kdeplot(data, x, y, hue, weights, palette, hue_order, hue_norm, color, fill, multiple, common_norm, common_grid, cumulative, bw_method, bw_adjust, warn_singular, log_scale, levels, thresh, gridsize, cut, clip, legend, cbar, cbar_ax, cbar_kws, ax, **kwargs)
   1713 if p.univariate:
   1715     plot_kws = kwargs.copy()
-> 1717     p.plot_univariate_density(
   1718         multiple=multiple,
   1719         common_norm=common_norm,
   1720         common_grid=common_grid,
   1721         fill=fill,
   1722         color=color,
   1723         legend=legend,
   1724         warn_singular=warn_singular,
   1725         estimate_kws=estimate_kws,
   1726         **plot_kws,
   1727     )
   1729 else:
   1731     p.plot_bivariate_density(
   1732         common_norm=common_norm,
   1733         fill=fill,
   (...)
   1743         **kwargs,
   1744     )

File /opt/hostedtoolcache/Python/3.9.16/x64/lib/python3.9/site-packages/seaborn/distributions.py:996, in _DistributionPlotter.plot_univariate_density(self, multiple, common_norm, common_grid, warn_singular, fill, color, legend, estimate_kws, **plot_kws)
    993 if "x" in self.variables:
    995     if fill:
--> 996         artist = ax.fill_between(support, fill_from, density, **artist_kws)
    998     else:
    999         artist, = ax.plot(support, density, **artist_kws)

File /opt/hostedtoolcache/Python/3.9.16/x64/lib/python3.9/site-packages/matplotlib/__init__.py:1423, in _preprocess_data.<locals>.inner(ax, data, *args, **kwargs)
   1420 @functools.wraps(func)
   1421 def inner(ax, *args, data=None, **kwargs):
   1422     if data is None:
-> 1423         return func(ax, *map(sanitize_sequence, args), **kwargs)
   1425     bound = new_sig.bind(ax, *args, **kwargs)
   1426     auto_label = (bound.arguments.get(label_namer)
   1427                   or bound.kwargs.get(label_namer))

File /opt/hostedtoolcache/Python/3.9.16/x64/lib/python3.9/site-packages/matplotlib/axes/_axes.py:5367, in Axes.fill_between(self, x, y1, y2, where, interpolate, step, **kwargs)
   5365 def fill_between(self, x, y1, y2=0, where=None, interpolate=False,
   5366                  step=None, **kwargs):
-> 5367     return self._fill_between_x_or_y(
   5368         "x", x, y1, y2,
   5369         where=where, interpolate=interpolate, step=step, **kwargs)

File /opt/hostedtoolcache/Python/3.9.16/x64/lib/python3.9/site-packages/matplotlib/axes/_axes.py:5272, in Axes._fill_between_x_or_y(self, ind_dir, ind, dep1, dep2, where, interpolate, step, **kwargs)
   5268         kwargs["facecolor"] = \
   5269             self._get_patches_for_fill.get_next_color()
   5271 # Handle united data, such as dates
-> 5272 ind, dep1, dep2 = map(
   5273     ma.masked_invalid, self._process_unit_info(
   5274         [(ind_dir, ind), (dep_dir, dep1), (dep_dir, dep2)], kwargs))
   5276 for name, array in [
   5277         (ind_dir, ind), (f"{dep_dir}1", dep1), (f"{dep_dir}2", dep2)]:
   5278     if array.ndim > 1:

File /opt/hostedtoolcache/Python/3.9.16/x64/lib/python3.9/site-packages/numpy/ma/core.py:2360, in masked_invalid(a, copy)
   2332 def masked_invalid(a, copy=True):
   2333     """
   2334     Mask an array where invalid values occur (NaNs or infs).
   2335
   (...)
   2357
   2358     """
-> 2360     return masked_where(~(np.isfinite(getdata(a))), a, copy=copy)

TypeError: ufunc 'isfinite' not supported for the input types, and the inputs could not be safely coerced to any supported types according to the casting rule ''safe''

As we can see in this dataset, these classes are quite separated.
X_train, X_test, y_train, y_test = train_test_split(df6[['x0','x1']],
                          df6['char'],
                          random_state = 4)
gnb.fit(X_train,y_train)
gnb.score(X_test,y_test)
0.72
But we do not get a very good classification score.
To see why, we can look at what it learned.
gnb.__dict__
{'priors': None,
 'var_smoothing': 1e-09,
 'classes_': array(['A', 'B'], dtype='<U1'),
 'feature_names_in_': array(['x0', 'x1'], dtype=object),
 'n_features_in_': 2,
 'epsilon_': 4.294249888888889e-09,
 'theta_': array([[3.91910256, 3.9624359 ],
        [4.42861111, 3.54222222]]),
 'var_': array([[4.0355774 , 3.99742099],
        [4.43948696, 4.14491451]]),
 'class_count_': array([78., 72.]),
 'class_prior_': array([0.52, 0.48])}
N = 100
gnb_df = pd.DataFrame(np.concatenate([np.random.multivariate_normal(th, sig*np.eye(2),N)
         for th, sig in zip(gnb.theta_,gnb.sigma_)]),
         columns = ['x0','x1'])
gnb_df['char'] = [ci for cl in [[c]*N for c in gnb.classes_] for ci in cl]

sns.pairplot(data =gnb_df, hue='char',hue_order=['A','B'])
---------------------------------------------------------------------------
AttributeError                            Traceback (most recent call last)
Cell In[9], line 3
      1 N = 100
      2 gnb_df = pd.DataFrame(np.concatenate([np.random.multivariate_normal(th, sig*np.eye(2),N)
----> 3          for th, sig in zip(gnb.theta_,gnb.sigma_)]),
      4          columns = ['x0','x1'])
      5 gnb_df['char'] = [ci for cl in [[c]*N for c in gnb.classes_] for ci in cl]
      7 sns.pairplot(data =gnb_df, hue='char',hue_order=['A','B'])

AttributeError: 'GaussianNB' object has no attribute 'sigma_'
This does not look much like the data and it’s hard to tell which is higher at any given point in the 2D space. We know though, that it has missed the mark. We can also look at the actual predictions.
df6pred = X_test.copy()
df6pred['pred'] =gnb.predict(X_test)

sns.pairplot(df6pred, hue = 'pred',hue_order=['A','B'])
---------------------------------------------------------------------------
TypeError                                 Traceback (most recent call last)
Cell In[10], line 4
      1 df6pred = X_test.copy()
      2 df6pred['pred'] =gnb.predict(X_test)
----> 4 sns.pairplot(df6pred, hue = 'pred',hue_order=['A','B'])

File /opt/hostedtoolcache/Python/3.9.16/x64/lib/python3.9/site-packages/seaborn/axisgrid.py:2148, in pairplot(data, hue, hue_order, palette, vars, x_vars, y_vars, kind, diag_kind, markers, height, aspect, corner, dropna, plot_kws, diag_kws, grid_kws, size)
   2146     diag_kws.setdefault("fill", True)
   2147     diag_kws.setdefault("warn_singular", False)
-> 2148     grid.map_diag(kdeplot, **diag_kws)
   2150 # Maybe plot on the off-diagonals
   2151 if diag_kind is not None:

File /opt/hostedtoolcache/Python/3.9.16/x64/lib/python3.9/site-packages/seaborn/axisgrid.py:1507, in PairGrid.map_diag(self, func, **kwargs)
   1505     plot_kwargs.setdefault("hue_order", self._hue_order)
   1506     plot_kwargs.setdefault("palette", self._orig_palette)
-> 1507     func(x=vector, **plot_kwargs)
   1508     ax.legend_ = None
   1510 self._add_axis_labels()

File /opt/hostedtoolcache/Python/3.9.16/x64/lib/python3.9/site-packages/seaborn/distributions.py:1717, in kdeplot(data, x, y, hue, weights, palette, hue_order, hue_norm, color, fill, multiple, common_norm, common_grid, cumulative, bw_method, bw_adjust, warn_singular, log_scale, levels, thresh, gridsize, cut, clip, legend, cbar, cbar_ax, cbar_kws, ax, **kwargs)
   1713 if p.univariate:
   1715     plot_kws = kwargs.copy()
-> 1717     p.plot_univariate_density(
   1718         multiple=multiple,
   1719         common_norm=common_norm,
   1720         common_grid=common_grid,
   1721         fill=fill,
   1722         color=color,
   1723         legend=legend,
   1724         warn_singular=warn_singular,
   1725         estimate_kws=estimate_kws,
   1726         **plot_kws,
   1727     )
   1729 else:
   1731     p.plot_bivariate_density(
   1732         common_norm=common_norm,
   1733         fill=fill,
   (...)
   1743         **kwargs,
   1744     )

File /opt/hostedtoolcache/Python/3.9.16/x64/lib/python3.9/site-packages/seaborn/distributions.py:996, in _DistributionPlotter.plot_univariate_density(self, multiple, common_norm, common_grid, warn_singular, fill, color, legend, estimate_kws, **plot_kws)
    993 if "x" in self.variables:
    995     if fill:
--> 996         artist = ax.fill_between(support, fill_from, density, **artist_kws)
    998     else:
    999         artist, = ax.plot(support, density, **artist_kws)

File /opt/hostedtoolcache/Python/3.9.16/x64/lib/python3.9/site-packages/matplotlib/__init__.py:1423, in _preprocess_data.<locals>.inner(ax, data, *args, **kwargs)
   1420 @functools.wraps(func)
   1421 def inner(ax, *args, data=None, **kwargs):
   1422     if data is None:
-> 1423         return func(ax, *map(sanitize_sequence, args), **kwargs)
   1425     bound = new_sig.bind(ax, *args, **kwargs)
   1426     auto_label = (bound.arguments.get(label_namer)
   1427                   or bound.kwargs.get(label_namer))

File /opt/hostedtoolcache/Python/3.9.16/x64/lib/python3.9/site-packages/matplotlib/axes/_axes.py:5367, in Axes.fill_between(self, x, y1, y2, where, interpolate, step, **kwargs)
   5365 def fill_between(self, x, y1, y2=0, where=None, interpolate=False,
   5366                  step=None, **kwargs):
-> 5367     return self._fill_between_x_or_y(
   5368         "x", x, y1, y2,
   5369         where=where, interpolate=interpolate, step=step, **kwargs)

File /opt/hostedtoolcache/Python/3.9.16/x64/lib/python3.9/site-packages/matplotlib/axes/_axes.py:5272, in Axes._fill_between_x_or_y(self, ind_dir, ind, dep1, dep2, where, interpolate, step, **kwargs)
   5268         kwargs["facecolor"] = \
   5269             self._get_patches_for_fill.get_next_color()
   5271 # Handle united data, such as dates
-> 5272 ind, dep1, dep2 = map(
   5273     ma.masked_invalid, self._process_unit_info(
   5274         [(ind_dir, ind), (dep_dir, dep1), (dep_dir, dep2)], kwargs))
   5276 for name, array in [
   5277         (ind_dir, ind), (f"{dep_dir}1", dep1), (f"{dep_dir}2", dep2)]:
   5278     if array.ndim > 1:

File /opt/hostedtoolcache/Python/3.9.16/x64/lib/python3.9/site-packages/numpy/ma/core.py:2360, in masked_invalid(a, copy)
   2332 def masked_invalid(a, copy=True):
   2333     """
   2334     Mask an array where invalid values occur (NaNs or infs).
   2335
   (...)
   2357
   2358     """
-> 2360     return masked_where(~(np.isfinite(getdata(a))), a, copy=copy)

TypeError: ufunc 'isfinite' not supported for the input types, and the inputs could not be safely coerced to any supported types according to the casting rule ''safe''

This makes it more clear. It basically learns one group that covers 3 blobs and only 1 for the second color. If we train again with a different random seed, it makes a different specific error, but basically the same idea.
X_train, X_test, y_train, y_test = train_test_split(df6[['x0','x1']],
                          df6['char'], random_state = 5)
gnb.fit(X_train,y_train)
gnb.score(X_test,y_test)
0.34
df6pred = X_test.copy()
df6pred['pred'] =gnb.predict(X_test)

sns.pairplot(df6pred, hue = 'pred')
---------------------------------------------------------------------------
TypeError                                 Traceback (most recent call last)
Cell In[12], line 4
      1 df6pred = X_test.copy()
      2 df6pred['pred'] =gnb.predict(X_test)
----> 4 sns.pairplot(df6pred, hue = 'pred')

File /opt/hostedtoolcache/Python/3.9.16/x64/lib/python3.9/site-packages/seaborn/axisgrid.py:2148, in pairplot(data, hue, hue_order, palette, vars, x_vars, y_vars, kind, diag_kind, markers, height, aspect, corner, dropna, plot_kws, diag_kws, grid_kws, size)
   2146     diag_kws.setdefault("fill", True)
   2147     diag_kws.setdefault("warn_singular", False)
-> 2148     grid.map_diag(kdeplot, **diag_kws)
   2150 # Maybe plot on the off-diagonals
   2151 if diag_kind is not None:

File /opt/hostedtoolcache/Python/3.9.16/x64/lib/python3.9/site-packages/seaborn/axisgrid.py:1507, in PairGrid.map_diag(self, func, **kwargs)
   1505     plot_kwargs.setdefault("hue_order", self._hue_order)
   1506     plot_kwargs.setdefault("palette", self._orig_palette)
-> 1507     func(x=vector, **plot_kwargs)
   1508     ax.legend_ = None
   1510 self._add_axis_labels()

File /opt/hostedtoolcache/Python/3.9.16/x64/lib/python3.9/site-packages/seaborn/distributions.py:1717, in kdeplot(data, x, y, hue, weights, palette, hue_order, hue_norm, color, fill, multiple, common_norm, common_grid, cumulative, bw_method, bw_adjust, warn_singular, log_scale, levels, thresh, gridsize, cut, clip, legend, cbar, cbar_ax, cbar_kws, ax, **kwargs)
   1713 if p.univariate:
   1715     plot_kws = kwargs.copy()
-> 1717     p.plot_univariate_density(
   1718         multiple=multiple,
   1719         common_norm=common_norm,
   1720         common_grid=common_grid,
   1721         fill=fill,
   1722         color=color,
   1723         legend=legend,
   1724         warn_singular=warn_singular,
   1725         estimate_kws=estimate_kws,
   1726         **plot_kws,
   1727     )
   1729 else:
   1731     p.plot_bivariate_density(
   1732         common_norm=common_norm,
   1733         fill=fill,
   (...)
   1743         **kwargs,
   1744     )

File /opt/hostedtoolcache/Python/3.9.16/x64/lib/python3.9/site-packages/seaborn/distributions.py:996, in _DistributionPlotter.plot_univariate_density(self, multiple, common_norm, common_grid, warn_singular, fill, color, legend, estimate_kws, **plot_kws)
    993 if "x" in self.variables:
    995     if fill:
--> 996         artist = ax.fill_between(support, fill_from, density, **artist_kws)
    998     else:
    999         artist, = ax.plot(support, density, **artist_kws)

File /opt/hostedtoolcache/Python/3.9.16/x64/lib/python3.9/site-packages/matplotlib/__init__.py:1423, in _preprocess_data.<locals>.inner(ax, data, *args, **kwargs)
   1420 @functools.wraps(func)
   1421 def inner(ax, *args, data=None, **kwargs):
   1422     if data is None:
-> 1423         return func(ax, *map(sanitize_sequence, args), **kwargs)
   1425     bound = new_sig.bind(ax, *args, **kwargs)
   1426     auto_label = (bound.arguments.get(label_namer)
   1427                   or bound.kwargs.get(label_namer))

File /opt/hostedtoolcache/Python/3.9.16/x64/lib/python3.9/site-packages/matplotlib/axes/_axes.py:5367, in Axes.fill_between(self, x, y1, y2, where, interpolate, step, **kwargs)
   5365 def fill_between(self, x, y1, y2=0, where=None, interpolate=False,
   5366                  step=None, **kwargs):
-> 5367     return self._fill_between_x_or_y(
   5368         "x", x, y1, y2,
   5369         where=where, interpolate=interpolate, step=step, **kwargs)

File /opt/hostedtoolcache/Python/3.9.16/x64/lib/python3.9/site-packages/matplotlib/axes/_axes.py:5272, in Axes._fill_between_x_or_y(self, ind_dir, ind, dep1, dep2, where, interpolate, step, **kwargs)
   5268         kwargs["facecolor"] = \
   5269             self._get_patches_for_fill.get_next_color()
   5271 # Handle united data, such as dates
-> 5272 ind, dep1, dep2 = map(
   5273     ma.masked_invalid, self._process_unit_info(
   5274         [(ind_dir, ind), (dep_dir, dep1), (dep_dir, dep2)], kwargs))
   5276 for name, array in [
   5277         (ind_dir, ind), (f"{dep_dir}1", dep1), (f"{dep_dir}2", dep2)]:
   5278     if array.ndim > 1:

File /opt/hostedtoolcache/Python/3.9.16/x64/lib/python3.9/site-packages/numpy/ma/core.py:2360, in masked_invalid(a, copy)
   2332 def masked_invalid(a, copy=True):
   2333     """
   2334     Mask an array where invalid values occur (NaNs or infs).
   2335
   (...)
   2357
   2358     """
-> 2360     return masked_where(~(np.isfinite(getdata(a))), a, copy=copy)

TypeError: ufunc 'isfinite' not supported for the input types, and the inputs could not be safely coerced to any supported types according to the casting rule ''safe''
X_train, X_test, y_train, y_test = train_test_split(df6[['x0','x1']],
                          df6['char'], random_state = 7)
gnb.fit(X_train,y_train)
gnb.score(X_test,y_test)
0.58
df6pred = X_test.copy()
df6pred['pred'] =gnb.predict(X_test)

sns.pairplot(df6pred, hue = 'pred')
---------------------------------------------------------------------------
TypeError                                 Traceback (most recent call last)
Cell In[14], line 4
      1 df6pred = X_test.copy()
      2 df6pred['pred'] =gnb.predict(X_test)
----> 4 sns.pairplot(df6pred, hue = 'pred')

File /opt/hostedtoolcache/Python/3.9.16/x64/lib/python3.9/site-packages/seaborn/axisgrid.py:2148, in pairplot(data, hue, hue_order, palette, vars, x_vars, y_vars, kind, diag_kind, markers, height, aspect, corner, dropna, plot_kws, diag_kws, grid_kws, size)
   2146     diag_kws.setdefault("fill", True)
   2147     diag_kws.setdefault("warn_singular", False)
-> 2148     grid.map_diag(kdeplot, **diag_kws)
   2150 # Maybe plot on the off-diagonals
   2151 if diag_kind is not None:

File /opt/hostedtoolcache/Python/3.9.16/x64/lib/python3.9/site-packages/seaborn/axisgrid.py:1507, in PairGrid.map_diag(self, func, **kwargs)
   1505     plot_kwargs.setdefault("hue_order", self._hue_order)
   1506     plot_kwargs.setdefault("palette", self._orig_palette)
-> 1507     func(x=vector, **plot_kwargs)
   1508     ax.legend_ = None
   1510 self._add_axis_labels()

File /opt/hostedtoolcache/Python/3.9.16/x64/lib/python3.9/site-packages/seaborn/distributions.py:1717, in kdeplot(data, x, y, hue, weights, palette, hue_order, hue_norm, color, fill, multiple, common_norm, common_grid, cumulative, bw_method, bw_adjust, warn_singular, log_scale, levels, thresh, gridsize, cut, clip, legend, cbar, cbar_ax, cbar_kws, ax, **kwargs)
   1713 if p.univariate:
   1715     plot_kws = kwargs.copy()
-> 1717     p.plot_univariate_density(
   1718         multiple=multiple,
   1719         common_norm=common_norm,
   1720         common_grid=common_grid,
   1721         fill=fill,
   1722         color=color,
   1723         legend=legend,
   1724         warn_singular=warn_singular,
   1725         estimate_kws=estimate_kws,
   1726         **plot_kws,
   1727     )
   1729 else:
   1731     p.plot_bivariate_density(
   1732         common_norm=common_norm,
   1733         fill=fill,
   (...)
   1743         **kwargs,
   1744     )

File /opt/hostedtoolcache/Python/3.9.16/x64/lib/python3.9/site-packages/seaborn/distributions.py:996, in _DistributionPlotter.plot_univariate_density(self, multiple, common_norm, common_grid, warn_singular, fill, color, legend, estimate_kws, **plot_kws)
    993 if "x" in self.variables:
    995     if fill:
--> 996         artist = ax.fill_between(support, fill_from, density, **artist_kws)
    998     else:
    999         artist, = ax.plot(support, density, **artist_kws)

File /opt/hostedtoolcache/Python/3.9.16/x64/lib/python3.9/site-packages/matplotlib/__init__.py:1423, in _preprocess_data.<locals>.inner(ax, data, *args, **kwargs)
   1420 @functools.wraps(func)
   1421 def inner(ax, *args, data=None, **kwargs):
   1422     if data is None:
-> 1423         return func(ax, *map(sanitize_sequence, args), **kwargs)
   1425     bound = new_sig.bind(ax, *args, **kwargs)
   1426     auto_label = (bound.arguments.get(label_namer)
   1427                   or bound.kwargs.get(label_namer))

File /opt/hostedtoolcache/Python/3.9.16/x64/lib/python3.9/site-packages/matplotlib/axes/_axes.py:5367, in Axes.fill_between(self, x, y1, y2, where, interpolate, step, **kwargs)
   5365 def fill_between(self, x, y1, y2=0, where=None, interpolate=False,
   5366                  step=None, **kwargs):
-> 5367     return self._fill_between_x_or_y(
   5368         "x", x, y1, y2,
   5369         where=where, interpolate=interpolate, step=step, **kwargs)

File /opt/hostedtoolcache/Python/3.9.16/x64/lib/python3.9/site-packages/matplotlib/axes/_axes.py:5272, in Axes._fill_between_x_or_y(self, ind_dir, ind, dep1, dep2, where, interpolate, step, **kwargs)
   5268         kwargs["facecolor"] = \
   5269             self._get_patches_for_fill.get_next_color()
   5271 # Handle united data, such as dates
-> 5272 ind, dep1, dep2 = map(
   5273     ma.masked_invalid, self._process_unit_info(
   5274         [(ind_dir, ind), (dep_dir, dep1), (dep_dir, dep2)], kwargs))
   5276 for name, array in [
   5277         (ind_dir, ind), (f"{dep_dir}1", dep1), (f"{dep_dir}2", dep2)]:
   5278     if array.ndim > 1:

File /opt/hostedtoolcache/Python/3.9.16/x64/lib/python3.9/site-packages/numpy/ma/core.py:2360, in masked_invalid(a, copy)
   2332 def masked_invalid(a, copy=True):
   2333     """
   2334     Mask an array where invalid values occur (NaNs or infs).
   2335
   (...)
   2357
   2358     """
-> 2360     return masked_where(~(np.isfinite(getdata(a))), a, copy=copy)

TypeError: ufunc 'isfinite' not supported for the input types, and the inputs could not be safely coerced to any supported types according to the casting rule ''safe''

If you try this again, split, fit, plot, it will learn different decisions, but always at least about 25% of the data will have to be classified incorrectly.
18.2. Decision Trees#
This data does not fit the assumptions of the Niave Bayes model, but a decision tree has a different rule. It can be more complex, but for the scikit learn one relies on splitting the data at a series of points along one axis at a time.
It is a discriminative model, because it describes how to discriminate (in the sense of differentiate) between the classes.
dt = tree.DecisionTreeClassifier()
dt.fit(X_train,y_train)
DecisionTreeClassifier()In a Jupyter environment, please rerun this cell to show the HTML representation or trust the notebook.
On GitHub, the HTML representation is unable to render, please try loading this page with nbviewer.org.
DecisionTreeClassifier()
dt.score(X_test,y_test)
1.0
The sklearn estimator objects (that corresond to different models) all have the same API, so the fit, predict, and score methods are the same as above. We will see this also in regression and clustering. What each method does in terms of the specific calculations will vary depending on the model, but they’re always there.
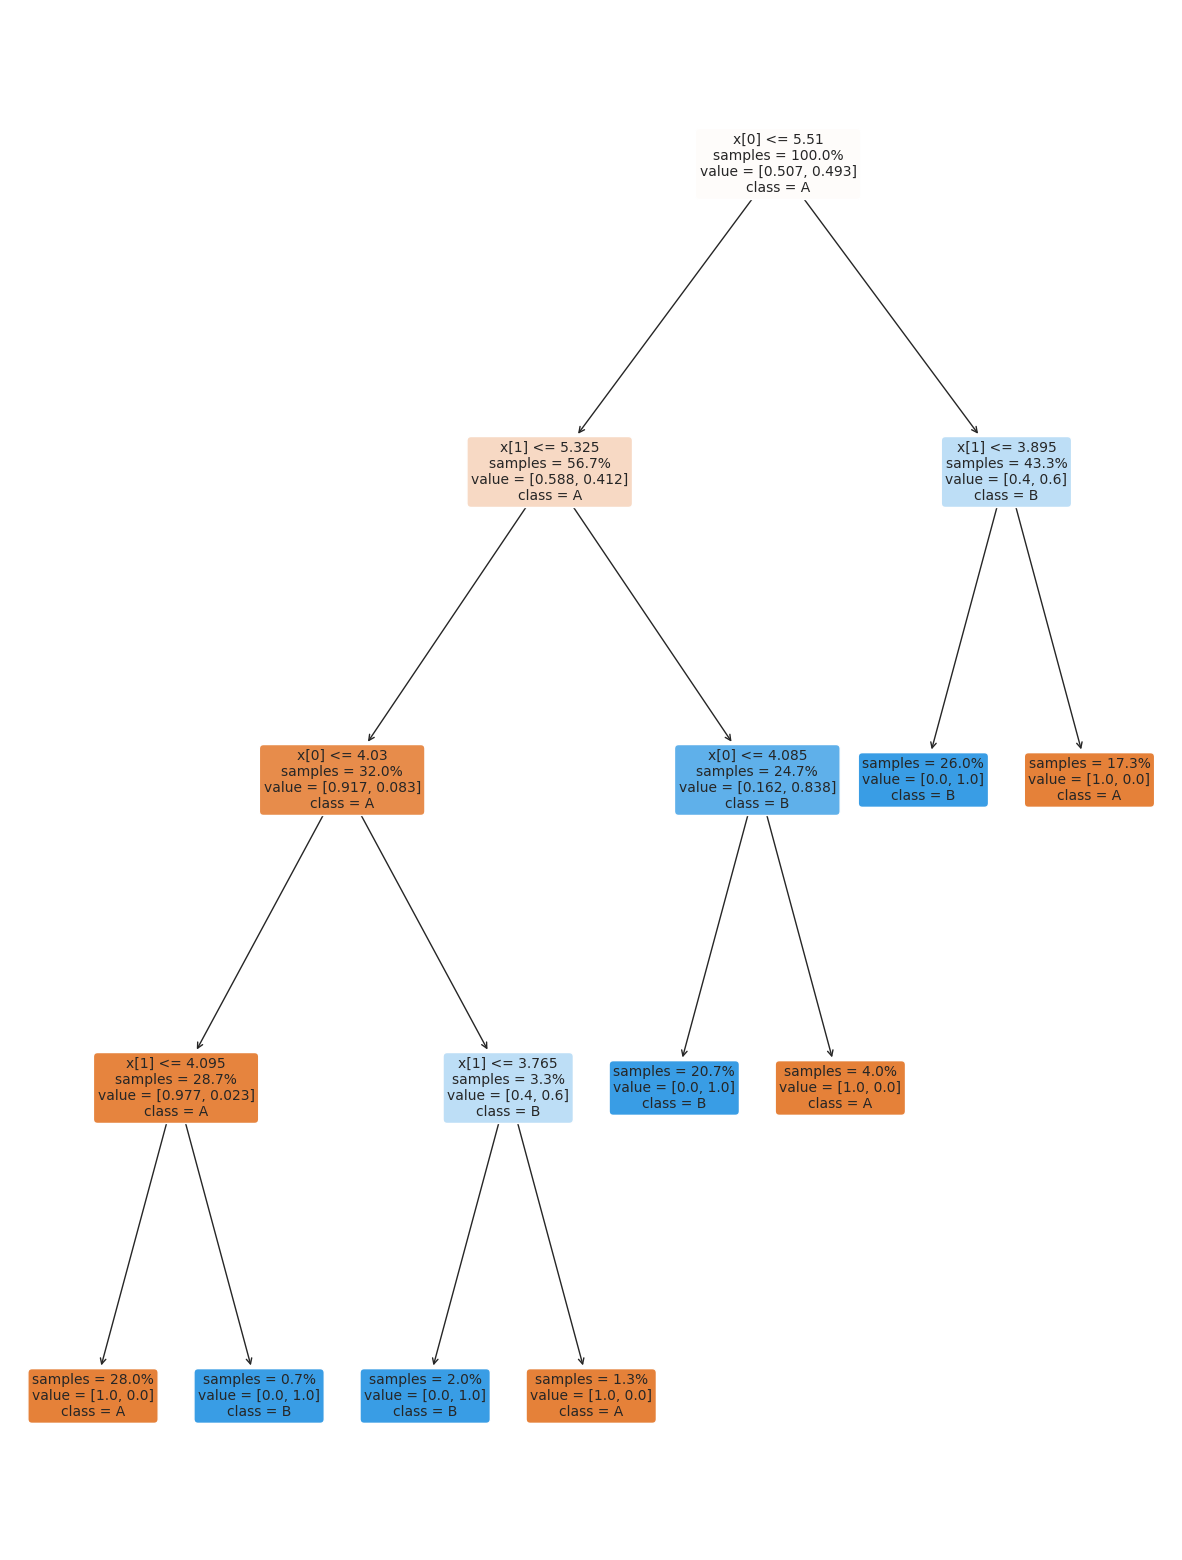
the tree module also allows you to plot the tree to examine it.
plt.figure(figsize=(15,20))
tree.plot_tree(dt, rounded =True, class_names = ['A','B'],
      proportion=True, filled =True, impurity=False,fontsize=10);
18.3. Setting Classifier Parameters#
The decision tree we had above has a lot more layers than we would expect. This is really simple data so we still got perfect classification. However, the more complex the model, the more risk that it will learn something noisy about the training data that doesn’t hold up in the test set.
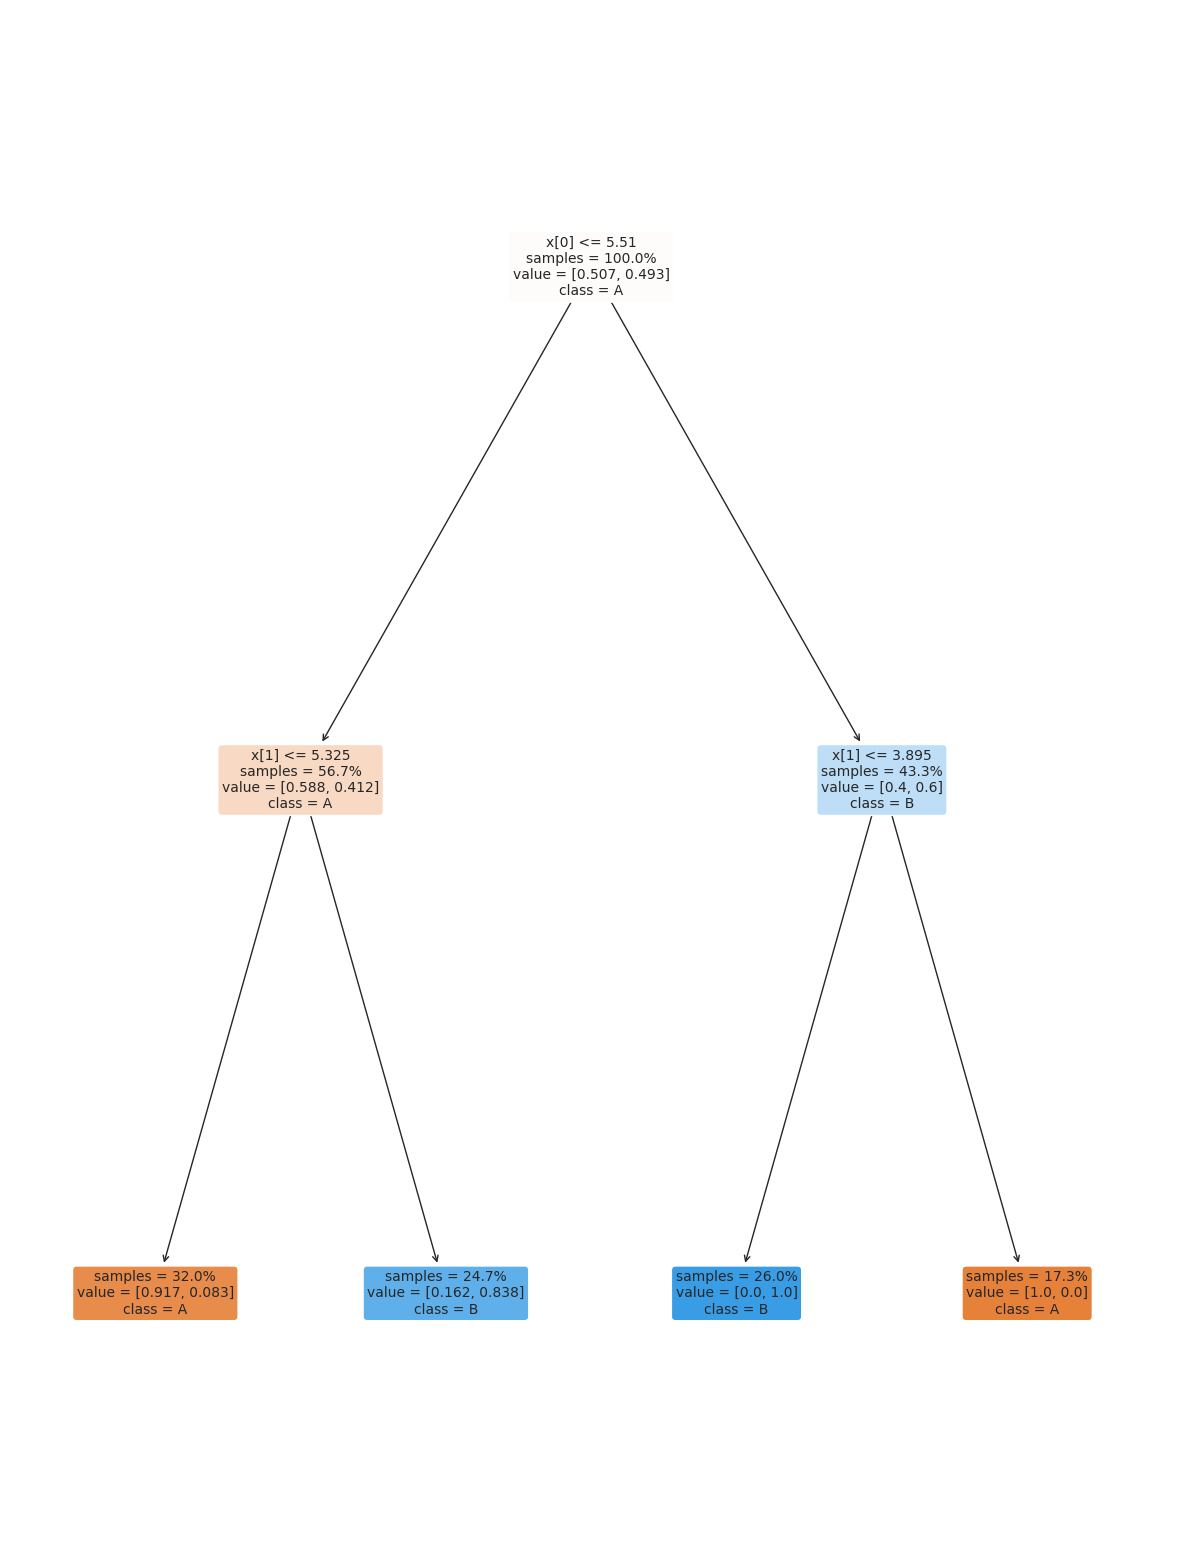
Fortunately, we can control the parameters to make it find a simpler decision boundary.
dt2 = tree.DecisionTreeClassifier(max_depth=2)
dt2.fit(X_train,y_train)
DecisionTreeClassifier(max_depth=2)In a Jupyter environment, please rerun this cell to show the HTML representation or trust the notebook.
On GitHub, the HTML representation is unable to render, please try loading this page with nbviewer.org.
DecisionTreeClassifier(max_depth=2)
plt.figure(figsize=(15,20))
tree.plot_tree(dt2, rounded =True, class_names = ['A','B'],
      proportion=True, filled =True, impurity=False,fontsize=10);

dt2.score(X_test,y_test)
0.86
We might need to play with different parameters to get it just how we want it. A simpler model is better because it will be more reliable in general.
dt2.score(X_test,y_test)
0.86
dt2_20 = tree.DecisionTreeClassifier(max_depth=2)
dt2_20.fit(X_train,y_train)
DecisionTreeClassifier(max_depth=2)In a Jupyter environment, please rerun this cell to show the HTML representation or trust the notebook.
On GitHub, the HTML representation is unable to render, please try loading this page with nbviewer.org.
DecisionTreeClassifier(max_depth=2)
dt2_20.score(X_test, y_test)
0.86
plt.figure(figsize=(15,20))
tree.plot_tree(dt2_20, rounded =True, class_names = ['A','B'],
      proportion=True, filled =True, impurity=False,fontsize=10);
18.4. Questions After Class#
18.4.1. What do the dots and lines represent in the graph?#
The scatter plots, each dot is one sample (row from the DataFrame), the different sub plots are different views of the data, determined by different pairs of variables.
The lines are the density, when it’s high it means values are likely , when it’s low it means they are unlikely.
18.4.2. What doe the GNB model do?#
When we fit, it learns a description of the data. When we predict it uses that description to predict the probability that each test sample belongs to each of the classes and returns the most probable one. See the last notes for a visualization of the probabilities.
18.4.3. Is xtrain ytrain, xtest ytest the same every time?#
Generally no, with the random_state variable set on a given data they will be the same subset every time, but without it would get different rows. For example:
X_train, X_test, y_train, y_test = train_test_split(df6[['x0','x1']],
                          df6['char'],
                          random_state = 4)
X_train.head()
| x0 | x1 | |
|---|---|---|
| 110 | 5.91 | 2.39 |
| 154 | 6.07 | 6.47 |
| 16 | 6.84 | 2.61 |
| 19 | 6.27 | 1.99 |
| 2 | 2.27 | 5.44 |
with random state, we get the same samples each time.
X_train, X_test, y_train, y_test = train_test_split(df6[['x0','x1']],
                          df6['char'])
X_train.head()
| x0 | x1 | |
|---|---|---|
| 45 | 2.23 | 2.55 |
| 93 | 2.35 | 2.06 |
| 47 | 2.50 | 5.99 |
| 36 | 1.85 | 6.50 |
| 109 | 6.07 | 2.65 |
X_train, X_test, y_train, y_test = train_test_split(df6[['x0','x1']],
                          df6['char'])
X_train.head()
| x0 | x1 | |
|---|---|---|
| 174 | 1.81 | 2.09 |
| 27 | 5.21 | 2.11 |
| 147 | 6.23 | 5.56 |
| 157 | 2.34 | 6.34 |
| 98 | 2.86 | 2.73 |
without, we get different ones.
18.4.4. I still want to know why it is worse to have a model that gets 100% accuracy with more depth to the decision tree flowchart than to have a model with less accuracy and less decisions in the decision tree.#
This accuracy is only on one set of training data, we might not want the big accuracy drop we saw here ,but we could do other things to improve it.